
Page 29 - JSW_Bolt_Cover
P. 29
INNOVATION JSW ENERGY BOLT | ISSUE 1
added which is significantly lower expected to stimulate power demand
compared to the fiscal year target going forward. The financial health and Power Market Analysis Report Nov-2018
of 21.8 GW. Growth in solar liquidity profile of the discoms has
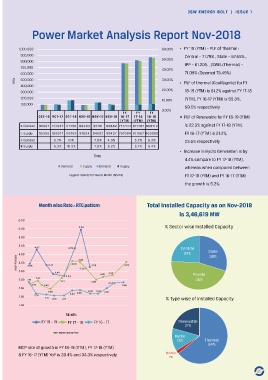
1,000,000 60.00% • FY ’19 (YTM) – PLF of Thermal :
capacity addition has been improved, gaining momentum 900,000 Central – 71.79% , State – 57.65% ,
50.00%
hindered by grid from the UDAY scheme. Further, 800,000 IPP – 61.20% , JSWEL(Thermal) –
700,000 40.00%
connectivity related issues, reforms in the power distribution 600,000 71.08% (Deemed 75.49%)
land acquisition bottle sector such as direct benefit MUs 500,000 30.00% • PLF of thermal (Coal/Lignite) for FY
400,000
necks, uncertainties over transfer scheme for plugging 300,000 20.00% 18-19 (YTM) is 61.2% against FY 17-18
safeguard duties and leakages in power sector 200,000 10.00% (YTM), FY 16-17 (YTM) is 59.3%,
100,000
depreciating Indian rupee. subsidies, implementation of 59.5% respectively
FY FY FY 0.00%
scheme for separation of carriage OCT-16 OCT-17 OCT-18 NOV-16 NOV-17 NOV-18 16-17 17-18 18-19 • PLF of Renewable for FY 18-19 (YTM)
The recently floated Draft (YTM) (YTM) (YTM)
of electricity (wires) and content Demand 95907 101327 111456 88303 95191 99882 773444 817487 868713 is 22.3% against FY 17-18 (YTM),
CERC Tariff Regulations for
(power supply), privatisation of Supply 95356 100377 110753 87654 94507 99427 767984 811557 863880 FY 16-17 (YTM) is 21.2%,
FY20-24 have maintained Demand 5.7% 10% 7.8% 4.9% 5.7% 6.3% 23.5% respectively
distribution etc. will help in
the base return on equity Supply 5.3% 10.3% 7.8% 5.2% 5.7% 6.4%
improving transparency in the • Increase in Hydro Generation is by
(RoE)and capital structure Time 4.4% compare to FY 17-18 (YTM),
system and enhance
guidelines. However, a slew Demand Supply Demand Supply whereas when compared between
sustainable profile of
of changes proposed in Legend: Stands for Year to Month (Nov’18) FY 17-18 (YTM) and FY 16-17 (YTM)
power assets.
other parameters present the growth is 5.2%.
a mixed bag for power With these positive
generators. The prospects and limited Month wise Rate - RTC pattern Total Installed Capacity as on Nov-2018
guidelines are capacity addition going is 3,46,619 MW
expected to be forward, thermal PLFs 6.50
finalised by end of may firm up over the 6.00 5.94 % Sector wise Installed Capacity
this fiscal year. medium to long-term. 5.50
We are also likely to 5.00 4.67 4.69 Central
Over the medium 24% State
see increased 30%
to long-term, the MCP /kWh 4.50 4.08
4.00
consolidation in the 3.98 3.73 4.09 3.59 4.02
outlook for the 3.50 3.46 3.55
power sector with 3.34 3.20 3.23 Private
power demand is 3.00 2.91 2.92 3.13 3.00 46%
introduction of Insolvency 2.77 2.59 2.54 2.56
robust in line with a 2.50
and Bankruptcy 2.49 2.43 2.46 2.32 2.32 2.50
strong expected GDP 2.00 2.32 2.31 2.16 2.17 % Type wise of Installed Capacity
Code(IBC)that will further aid the
growth, and various measures by 1.50
demand-supply balancing. However,
Government of India such as UDAY Month
higher imported coal prices and FY 18 - 19 FY 16 - 17 Renewable
scheme, ‘Saubhaghya’ scheme etc. The FY 17 - 18 21%
constrained domestic coal availability,
country achieved electrification of all its MCP: Market Clearing Price Hydro
especially for private sector power plants, Thermal
villages by end of April’18 and is on track 13% 64%
continue to remain key concerns for the MCP rate of growth in FY 18-19 (YTM), FY 17-18 (YTM)
to complete electrification of all Nuclear
thermal sector. & FY 16-17 (YTM) YoY is 30.4% and 34.3% respectively 2%
households in FY19. All these are
24 25