
Page 28 - Cover options
P. 28
INNOVATION
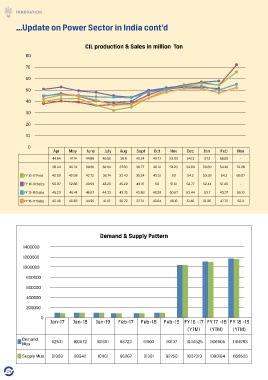
...Update on Power Sector in India cont’d
CIL production & Sales in million Ton
80
70
60
50
40
30
20
10
0
Apr May June July Aug Sept Oct Nov Dec Jan Feb Mar
44.84 47.14 44.88 40.56 38.8 40.24 49.77 52.09 54.13 57.2 58.05 -
38.44 40.74 39.66 36.64 37.59 38.77 46.14 51.29 54.63 56.69 54.46 72.28
FY 16-17 Prod 40.09 42.58 42.72 36.74 32.43 35.24 43.51 50 54.2 55.99 54.3 66.07
FY 18-19 Sales 50.97 52.86 49.59 48.25 45.22 43.91 50 51.01 52.77 52.44 51.45 -
FY 17-18 Sales 45.29 46.41 45.67 44.33 43.75 43.58 48.28 50.67 53.44 53.7 49.97 55.19
FY 16-17 Sales 42.45 45.53 44.96 41.47 36.72 37.74 43.04 48.16 51.46 51.35 47.73 52.3
Demand & Supply Pattern
1400000
1200000
1000000
800000
600000
400000
200000
0
Jan-17 Jan-18 Jan-19 Feb-17 Feb-18 Feb-19 FY 16 -17 FY 17 -18 FY 18 -19
(YTM) (YTM) (YTM)
Demand 92531 100572 101651 86723 91903 93137 1044525 1106905 1164783
Mus
Supply Mus 91909 99942 101161 86267 91301 92756 1037319 1099164 1158525
24