Page 26 - Cover options
P. 26

INNOVATION

        overall robust economic  peaked in October 2018;  power generation for 77.4%

        growth. During Apr-Jan’19  nevertheless, moderated to  of its electricity, while hydro
        (FY19-YTD) period, power  remain                 range        bound constituted                   10.3%,

        demand rose 5.7% on a YoY  between Rs 3.0-3.6/unit  renewables 9.3%, and rest
        basis driven by traction in  since November 2018.                       from       other       sources.

        West, South and                                                         However, the share of
                                            On     the     supply       side,
        East regions.                                                           renewables is slowly inching
                                            generation growth has kept
        On backdrop of strong power  pace with demand growth at                 up with increasing capacity
                                                                                additions in this segment.
        demand         growth,       the 5.8% in FY19-YTD on a YoY
        merchant                 market basis. India relies on thermal

        environment has also been
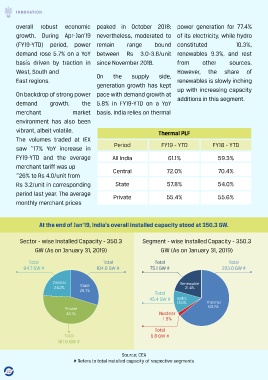
        vibrant, albeit volatile.                                      Thermal PLF

        The volumes traded at IEX
                                                    Period               FY19 - YTD            FY18 - YTD
        saw  ~17% YoY increase in

        FY19-YTD and the average                   All India                61.1%                 59.3%
        merchant tariff was up
                                                   Central                 72.0%                  70.4%
        ~26% to Rs 4.0/unit from
        Rs 3.2/unit in corresponding                State                  57.8%                  54.0%

        period last year. The average              Private                 55.4%                  55.6%
        monthly merchant prices


                  At the end of Jan’19, India’s overall installed capacity stood at 350.3 GW.


          Sector - wise Installed Capacity - 350.3              Segment - wise Installed Capacity - 350.3
                 GW (As on January 31, 2019)                             GW (As on January 31, 2019)


              Total                            Total                  Total                            Total
           84.7 GW #                        104.0 GW #              75.1 GW #                       223.0 GW #


                         Central                                                 Renewable
                         24.2%       State                                         21.4%
                                    29.7%
                                                                      Total
                                                                   45.4 GW #    Hydro
                                                                                13.0%        Thermal
                              Private                                                         63.7%
                              46.1%                                     Nuclear
                                                                         1.9%

                                                                      Total
                             Total                                  6.8 GW #
                           161.5 GW #


                                                       Source; CEA
                                  # Refers to total installed capacity of respective segments

    22
   21   22   23   24   25   26   27   28   29   30   31