JSW Steel Ltd. (JSW Steel), the flagship company of the US$14 billion JSW Group, is an Indian integrated steel major. The Company has an installed capacity of 18 MTPA across seven state-of-the-art manufacturing facilities in India.
The Company also develops and markets marginaccretive, value-added and special products (VASP), such as Galvanised and Colour Coated products, Special Bars and Special TMT, among several others. They find increasing applications in automobile, construction and appliances industries. The Company also has a strong domestic retail presence, with over 9,500 direct and indirect outlets, and exports to over 100 countries across five continents.
JSW Steel was included in the National Stock Exchange’s benchmark index of India’s top 50 companies, Nifty50 in September 2018, which is a testament to its growing size and scale, and ability to consistently create value for its stakeholders. A similar recognition was the Deming Prize, the world’s most coveted recognition for quality, awarded to the Company’s Vijayanagar facility during the year.
JSW Steel is driven by integrated thinking and follows a multi-capital approach to value creation. Driven by the credo of ‘Better Everyday’, the Company continuously engages in cost and operating efficiency improvement programmes across its facilities, which results in lower operating costs, better quality and higher profitability. JSW Steel is one of the most efficient steel producers in the world with conversion cost in first quartile.
At the heart of efficiency lies the Company’s strong sourcing strategy. JSW Steel has invested in a robust backward integration programme by securing six iron ore mines in recent open mine auctions in the state of Karnataka. The Company has acquired facilities in the US and Italy, and picked up a joint controlling stake in Monnet Ispat & Energy Limited through the IBC (Insolvency and Bankruptcy Code) process.
JSW Steel has initiated a strategic capex plan of `48,715 crore through to FY 2021-22 towards augmenting the installed capacity to 24 MTPA from the current 18 MTPA, reducing costs and improving the sales mix.
Quick facts
18 MTPA*
Installed capacity
9,500+
Exclusive and non-exclusive retail outlets
`48,715 crore
Exclusive and non-exclusive retail outlets
7
Manufacturing facilities in India
3
Acquisitions
6
Iron ore mines
JSW Steel maintains an unwavering focus on environment, health and safety (EHS), and engages continuously with the communities who are in the direct impact zones of its operations. The Company’s Corporate Social Responsibility (CSR) initiatives go way beyond compliance and play a crucial role in uplifting the lives and livelihoods of those impacted.
1.1 Global economy
MODERATING GROWTH ACROSS THE GLOBE
CY 2018 started on an optimistic note with global growth expectations pegged at 3.9%, driven by strong economic activity and policy-level interventions. In the first half of the year, economic growth remained robust backed by the US fiscal stimulus plan rolled out in December 2017 and the resilient emerging markets. A steady global oil consumption and rally in oil prices also supported the growth.
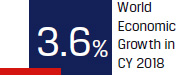
However, in the second half of CY 2018, fears of trade wars among major economies, especially between the US and China, weighed on the growth momentum significantly. In addition to trade wars, geopolitical tensions across regions proved as headwinds. The world economy grew at 3.6% in CY 2018 comparable to CY 2017 levels but below 3.9% expected at the start of the year.
The Eurozone witnessed slowdown in growth due to political uncertainties like Brexit and the disruption of automobile production in Germany caused by the new emission norms. The region also witnessed softening of overall external demand from emerging Asia. This was further met with a drop in investment in Italy due to widening sovereign spreads.
In the Far East, Japan was hit by natural disasters. China’s growth declined following a combination of much needed regulatory tightening to rein in shadow banking and an increase in trade tensions with the United States. Emerging market economies such as Argentina and Turkey remained stressed.
That said, through the middle of CY 2019, global growth is likely to witness an uptick driven by an expected monetary policy easing by central banks. The economies currently engaged in trade wars have also initiated high-level dialogues to resolve the contentious issues.
Source: International Monetary Fund
1.1.1 OUTLOOK
The International Monetary Fund (IMF) expects the global economic growth to further slow down to 3.3% in CY 2019, as the issues that plagued the major economies in the second half of CY 2018 are likely to spill over to the first half of CY 2019 and the effects of US policy stimulus are likely to taper off. Growth is likely to gradually pick up and stabilise at 3.6% in CY 2020, as the centrals banks of most major economies shift to a more accommodative policy stance and China ramps-up its economic stimulus to minimise the impact of increased tariffs.
Region-wise growth outlook estimates (In %)
| Region | 2017 | 2018 | 2019 | 2020(E) |
|---|---|---|---|---|
| World | 3.8 | 3.6 | 3.3 | 3.6 |
| AMEs | 2.4 | 2.2 | 1.8 | 1.7 |
| EMEs | 4.8 | 4.5 | 4.4 | 4.8 |
| ASEAN | 5.4 | 5.2 | 5.1 | 5.2 |
| US | 2.2 | 2.9 | 2.3 | 1.9 |
| EU - 28 | 2.7 | 2.1 | 1.6 | 1.7 |
| China | 6.8 | 6.6 | 6.3 | 6.1 |
| Japan | 1.9 | 0.8 | 1 | 0.5 |
| Russia | 1.6 | 2.3 | 1.6 | 1.7 |
The World Trade Organisation (WTO) expects global merchandising trade volume growth to slow to 2.6% in CY 2019 from 3.0% in CY 2018, but could rebound to 3.0% in CY 2020, as the trade tensions subside. The short- and medium-term outlook appears positive, and international bodies including the IMF have urged the member countries not to escalate trade tensions or tighten policies that could affect the current situation. There is a broadlevel consensus on this, though the challenge for them would be to contain inflationary tendencies while endorsing a neutral to accommodative monetary policy.
1.2.Indian economy
INDIA REMAINS THE FASTEST GROWING MAJOR ECONOMY
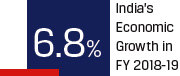
The Indian economy grew at 6.8% and remained the world’s fastest growing major economy despite a visible slowdown in the fourth quarter of FY 2018-19.
Since 2012, India has outperformed the global growth trend
| Year | Global GDP growth rate (%) |
Indian GDP growth rate (%) |
Difference |
| 2012 | 3.5 | 5.5 | 2.0 |
| 2013 | 3.5 | 6.4 | 2.9 |
| 2014 | 3.6 | 7.4 | 3.8 |
| 2015 | 3.4 | 8.0 | 4.6 |
| 2016 | 3.4 | 8.1 | 4.7 |
| 2017 | 3.8 | 7.2 | 3.4 |
| 2018 | 3.6 | 7.1 | 3.5 |
(Source: IMF’s World Economic Outlook - April 2019)
Consumption remained the larger driver, supported by rising disposable income and subsequent increases in spending. Rural demand grew on the back of higher disposable income, increase in minimum support prices (MSPs) and a normal monsoon. Technology, led by a pervasive mobile network, was also a huge enabler for consumption. Structural reforms such as the Goods and Services Tax (GST) have paved the way for a more formalised and organised economy. These factors, combined with a rebound in credit growth, spurred investment during the fiscal.
The government’s infrastructure push is visible across the country. Large-scale metro rail projects; dedicated freight corridors and transport ways network through the ‘Bharatmala Pariyojana’; and port development through the ‘Sagarmala’ programme are progressing in full swing. This has resulted in an increase in Gross Fixed Capital (GFC) formation.
GFC formation grew by 10.0% in FY 2018-19, up from 9.3% in FY 2017-18.
Government programmes boosting development
The Indian government has rolled out several initiatives, such as the National Mineral Policy and National Electronic Policy, to fast-track development. Similarly, the Agriculture Export Policy was introduced with a mandate to double agriculture exports to US$60 billion by 2022.
The Union Budget (interim) has also announced several initiatives aimed at socioeconomic development and enhancing consumption. These include direct income support schemes for small and marginal farmers, income tax provisions for exemption till 5 lakh and pension programmes for the unorganised sector.
India jumped 23 places to rank 77 on the World Bank’s Ease of Doing Business Index, which testifies to the Indian government’s focus on making the country an attractive investment destination. India was ranked 58 by the World Economic Forum in terms of competitiveness out of 170 economies. India jumped five places in the competitive index (as per previous methodology), the highest gain among all G20 countries and topped in South Asia.
Average industrial production witnessed marginal growth. As per the latest (April 2019) available data, the eight core industries together grew at 4.3% in FY 2018-19 with cement, steel, fertiliser and refinery products bolstering the index. The eight core industries account for ~41% of India’s Index of Industrial Production (IIP).
Prices remained largely benign, led by food articles and oil. Headline consumer price inflation (CPI) remained under the targeted 4%. Overall, CPI inflation fell from 3.7% in August- September 2018 to 2.86% in March 2019, after touching a low of 2.0% in January 2019. This has a bearing on overall growth and employment. Liquidity tightness was evidenced by high creditdeposit ratios and elevated corporate bond spreads.
During the year, the financial services industry went through a turbulent phase. NBFCs in particular, experienced a liquidity crisis owing to asset-liability issues, the fallout of which was evident in pessimistic investor sentiment and an overall constrained access to capital.
2019-2020 World Economy Growth Contribution (Intl US$)
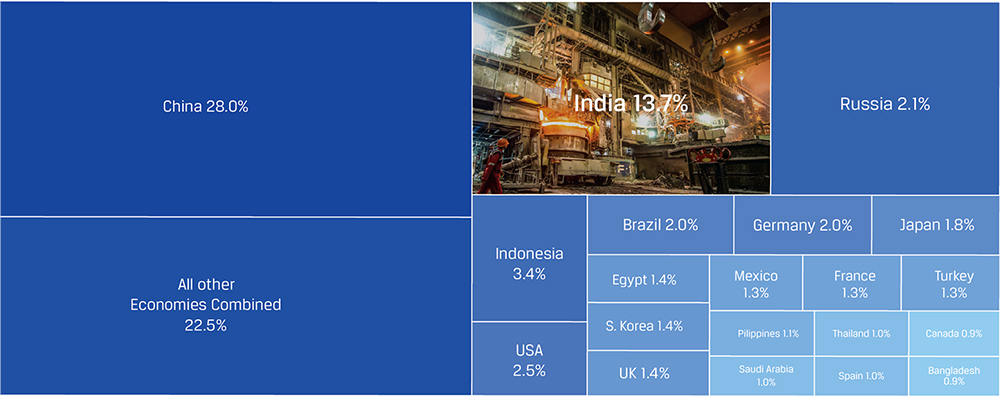
(Source: IMF’s World Economic Outlook - April 2019)
THE LIQUIDITY TIGHTNESS PROMPTED THE RBI TO CUT THE REPO RATE BY 25 BPS TO 6%, THE SECOND CUT IN THREE MONTHS, MAKING INDIA THE ONLY ECONOMY IN ASIA TO HAVE HAD IMPLEMENTED TWO CONSECUTIVE POLICY RATE CUTS. THE COMBINED 50 BPS CUT ALSO REFLECTED THE RBI’S INTENT OF INFUSING LIQUIDITY TO KICKSTART THE ECONOMY WHICH IS EXPERIENCING A SOFT PATCH.
India’s forex reserves remained buoyant, at US$411 billion during the last week of March 2019. Merchandise exports grew by 8.75% y-o-y to US$331.06 billion and services exports rising 17% y-o-y to US$204.7 billion (Source: Ministry of Commerce and DGFT).
1.2.1 OUTLOOK
According to the IMF, India is expected to grow at 7.3% in CY 2019 and 7.5% in CY 2020, driven by a continued recovery in investment (9.4% growth) and robust consumption. Going forward, the Indian economy is expected to contribute 13.7% to total world economic growth, which is higher than that of several developed countries, including the US (Source: Bloomberg).
With the general election overhang now behind us and a stable government elected at the centre, any uncertainty around policy continuity or visibility has subsided. Continued economic reforms, along with efforts to reduce public debt, is a prerequisite for the country’s growth. Given the strong mandate, the government is likely to push through key structural reforms towards its ambition of making India a US$5 trillion economy by 2024.
2.1 Global steel industry
STEEL DEMAND AND SUPPLY RISE; UTILISATION IMPROVES
Global steel demand grew by 2.1%* in CY 2018, largely driven by China, coupled with an investment-led recovery in the advanced economies. Global crude steel production reached 1,808.6 million tonnes (MnT) in CY 2018, up 4.6% from CY 2017 levels, pushing capacity utilisation above 70% (source: Worldsteel).
Steel spreads were stronger in the first half of CY 2018, driven by strong economic activity and further supported by on going trade tensions between major economies. In the second half of CY 2018, moderation in the global economic growth led to softening of steel prices, thereby adversely impacting the spreads.
In terms of trade protectionism, the US adopted strong safeguards while Europe imposed a quota system. As a result, countries like China were displaced from these markets.
US trade protection shifts global steel market dynamics
The US proclaimed Section 232 on imports of steel and aluminium by imposing a 25% and 10% duty, respectively, for select countries including India, citing national security concerns. The US advocacy to promote domestic steel for domestic consumption has led to a growing threat of trade diversion, igniting a global trade friction spanning China and Europe. This is likely to spill over to other economies and trade beyond steel.
EU steel import curbs continue
In July 2018, the European Union imposed a tariff-rate quota by which a duty of 25% was applicable whenever the level of imports breached the quota set at the three-year average of trade inflows, plus 5%. Initially announced as a provisional move, the cap will remain effective on all steel imports until July 2021. The quota has impacted automotive manufacturers in the region who have been dependent on imported steel. Going forward, as the US government’s stance on import curbs and tariffs stiffens and the import quota in the EU continues, it is expected to pose headwinds for the steel sector globally.
Supply-side structural reforms by China to streamline capacities
China has taken a conscious call to close excess and inefficient capacities across various core sectors including steel and coal. Between 2016 and 2020, the country has set a steep target of closing down 200 MnT of inefficient capacity. Till 2017, China had already closed down 115 MnT of steel capacities. This, coupled with the restructuring of the 140 MnT induction furnace capacities, has benefitted market sentiment, pricing power, and bottom-lines of most Chinese steel producers.
On average, metal prices rose 6% in CY 2018 (Source: World Bank), dragged down by broad-based tariffs imposed by the US on China’s imports in the second half. Heightened trade tensions dampened market sentiments for global trade and investment prospects. Following the specific tariffs announcement, prices of steel and aluminium recouped in the US.
* Note: China closed most of its outdated induction furnaces in 2017, a category which was generally not captured in official statistics. With closure of the induction furnaces, the demand from this sector of the market is now satisfied by mainstream steel makers and therefore captured in the official statistics in 2017. Consequently, the nominal growth rate for steel demand in China increased to 7.9% or 835 MnT. Disregarding this statistical base effect Worldsteel expects that the underlying growth rate of China’s steel demandfor 2018 will be 2.0%, which will make the corresponding global growth rate 2.1%. (Source : Worldsteel)Global steel trade updates
a. China’s steel exports down from 72 MnT in CY 2017 to 69 MnT in CY 2018, from a peak of 112 MnT in CY 2015
b. Japan’s exports fell 37.5 MnT in CY 2017 to 35.8 MnT in CY 2018, from a peak of 41 MnT in CY 2015
c. Korean exports declined from 31 MnT in CY 2017 to 30 MnT in CY 2018; imports fell sharply from a peak of 23 MnT in CY 2016 to 15 MnT in CY 2018
d. US imports continued to fall, from 34 MnT in CY 2017 to 31 MnT in CY 2018, after peaking at 41 MnT in CY 2014
e. In Europe, third country imports increased from 42 MnT in CY 2017 to 46 MnT in CY 2018
Source: Worldsteel
World crude steel production - summary
| Millon tonnes (MnT) | 2018 | 2017 | 2018/2017 % |
|---|---|---|---|
| Europe of which: |
311.8 | 311.7 | 0.0 |
| EU (28) | 168.1 | 168.5 | -0.3 |
| CIS | 101.3 | 100.9 | 0.3 |
| North America of which: |
120.5 | 115.8 | 4.1 |
| United States | 86.7 | 81.6 | 6.2 |
| South America | 44.3 | 43.7 | 1.3 |
| Africa | 16.1 | 15.1 | 7.2 |
| Middle East | 38.5 | 34.5 | 11.7 |
| Asia of which: |
1271.1 | 1203.2 | 5.6 |
| China | 928.3 | 870.9 | 6.6 |
| Japan | 104.3 | 104.7 | -0.3 |
| Australia/New Zealand | 6.3 | 6.0 | 5.9 |
| World | 1808.6 | 1729.8 | 4.6 |
Top 10 steel-producing countries
| Country | 2018(MnT) | 2017(MnT) | % 2018/2017 |
|---|---|---|---|
| China | 928.3 | 870.9 | 6.6 |
| India | 106.5 | 101.5 | 4.9 |
| Japan | 104.3 | 104.7 | -0.3 |
| United States | 86.7 | 81.6 | 6.2 |
| South Korea | 72.5 | 71.0 | 2.0 |
| Russia (e) | 71.7 | 71.5 | 0.3 |
| Germany (e) | 42.4 | 43.3 | -2.0 |
| Turkey | 37.3 | 37.5 | -0.6 |
| Brazil | 34.7 | 34.4 | 1.1 |
| Iran (e) | 25.0 | 21.2 | 17.7 |
While China leads production volumes with more than 51% share, India displaced Japan as the world’s second largest steel producer at the start of CY 2019. According to Worldsteel, India’s crude steel production in CY 2018 was at 106.5 MnT, up 4.9% from 101.5 MnT in CY 2017. Japan produced 104.3 MnT in CY 2018, down 0.3% from CY 2017 levels.
2.1.1 OUTLOOK
Worldsteel expects global demand for finished steel to grow by 1.3% in CY 2019 to touch 1,735 MnT and by 1.0% in CY 2020 to 1,751.6 MnT.
Top 10 countries in 2015 and 2020
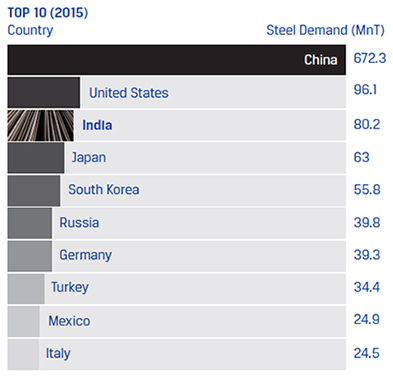
TOP 10 (2020)
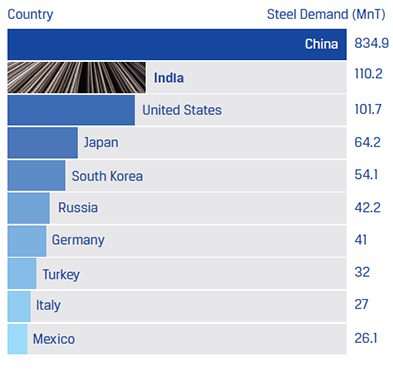
Steel demand, finished steel (SRO April 2019)
| 2018 (MnT) |
2019 (MnT) |
2020 (MnT) |
18/17 (%) |
19/18 (%) |
20/19 (%) |
2020 as % of 2007 |
|
|---|---|---|---|---|---|---|---|
| World | 1712.1 | 1735.0 | 1751.6 | 4.9/2.1 | 1.3 | 1.0 | 143.0 |
| China | 835.0 | 843.3 | 834.9 | 7.9/2.0 | 1.0 | -1.0 | 199.5 |
| United States | 100.2 | 101.4 | 101.7 | 2.5 | 1.3 | 0.3 | 93.9 |
| European Union (28) | 169.7 | 170.2 | 172.2 | 4.3 | 0.3 | 1.2 | 84.9 |
| India | 96 | 102.8 | 110.2 | 4.3 | 7.1 | 7.2 | 214.1 |
| Japan | 65.4 | 64.7 | 64.2 | 3.7 | -1.0 | -0.8 | 78.1 |
| South Korea | 53.6 | 53.4 | 54.1 | -1.2 | -0.4 | 1.3 | 98 |
| Russia | 41.2 | 41.6 | 42.2 | 0.7 | 1 | 1.5 | 104.5 |
| Turkey | 30.6 | 29.1 | 31.4 | -14.9 | -4.9 | 8.0 | 132.1 |
Emerging trends in steel
Recyclability of steel
Steel is the world’s most recycled material and it maintains an average of 86% recyclability. Its metallurgical properties allow it to be recycled continually with no degradation in product performance. A considerable proportion of steel demand can thus be met using converted steel scrap and this trend is gaining prevalence across the globe and is making inroads in India too.
Globally, scrap steel finds its recycled applications in several industries, including automobiles. On an average, recycled steel contributes to 25% of steel used in cars worldwide. Global ferrous scrap availability stood at about 750 MnT in CY 2017, 84% of which was recycled by the global steel and foundry casting industries. By 2030, the global scrap availability is expected to touch 1 billion tonnes and by the mid of the century, reach 1.3 billion tonnes.
In India overall ferrous scrap usage is expected to rise to 22.36 MnT in 2023.
Lightweighting of steel
Lightweight, high-strength and high-tensile steel is being demanded by customers worldwide. They result in better efficiency in areas where it finds applications. Indirectly they also contribute to the reduction of greenhouse gas emissions.
Lightweight steel finds increasing applications in automobiles, aviation and wind energy sectors. Together with lightweight aluminium and carbon fiber, high-strength and lightweight steel is expected to create a global market of 300 billion euros.
Consequently, value engineering has taken centre stage, with an objective to explore different material mixes and grades and achieve development of lighter and stronger products.
China, which accounts for the largest share of global steel demand, is being supported by a mild fiscal stimulus. This stimulus should act as a counterbalance to the ongoing China-US trade tensions. China’s domestic steel demand growth is thus projected to remain flattish, at 1% to reach 843 MnT in CY 2019. After the implementation of trade restrictions, US steel demand is expected to grow 1.3%. Demand across Europe will likely remain subdued at 170 MnT in CY 2019, or exhibit marginal growth.
Emerging economies exhibit a positive, mixed outlook. Asia is expected to showcase a stellar performance, MENA and CIS could witness subdued growth and Latin America is likely to recover. India, with its increased focus on infrastructure development, should continue to witness an upward trend in domestic demand. Industry-wide consolidations and opening up of raw material sources continue to drive efficiencies, incentivising steel production.
To summarise, CY 2019 and CY 2020 will likely witness global steel demand continuing on its growth path, with growth trends moderating in tandem with a slowing economy. Any escalation of the ongoing trade tensions, increase in inflationary pressure and tightening of US and EU monetary policies could elevate market volatility and pose downside risks to the forecast. The overall outlook, however, remains optimistic.
2.2 Indian steel sector
DEMAND DRIVEN BY INFRASTRUCTURE; PRODUCTION AND CAPACITIES RISE
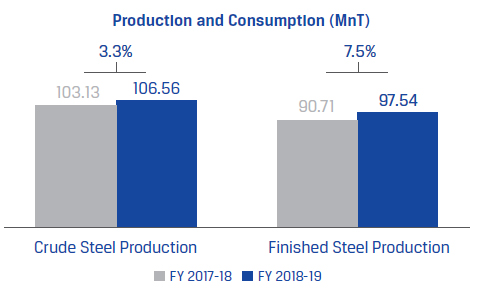
India’s crude steel production grew 3.3% to 106.56 MnT in FY 2018-19, making it the world’s second largest steel producer, behind China. Steel exports fell 26.4% to 8.54 MnT as global demand weakened due to geopolitical uncertainties and additional tariffs on imports by the US. Finished and semifinished steel imports rose by 4.6% to reach 8.79 MnT. The domestic market saw rising imports from China, Japan and Korea.
Source: Joint Plant Committee
Performance highlights - Indian Steel Industry
(Source: Joint Plant Committee Report, March 2019)- Steel demand growth at 7.5% y-o-y (to 97.5 MnT) outpaced production growth at 3.3% y-o-y (to 106.6 MnT) in FY 2018-19.
- Total finished steel imports rose 4.6% to 8.8 MnT, displacing 15% of flat steel demand, 9% of total Indian steel demand.
- Indian exports plummeted 26% to 8.5 MnT in FY 2018-19 due to increased protectionism across the world.
- Per capita steel consumption rose from 69 kg to 73 kg; demand for flat products grew 4.2% while that for long products grew 10.4%. The share of flat and long products remained unchanged at 46% and 54%.
During FY 2018-19, domestic steel consumption increased 7.5% to 97.54 MnT, primarily driven by government expenditures on infrastructure (the central and state governments’ infra spending pegged at `7-8 lakh crore). The infrastructure, construction and real estate sectors accounted for 60-65% of domestic steel consumption.
Trade action and their impact on steel market
Global trade is an important growth enabler for any sector. According to a BCG analysis, global steel exports have been growing in absolute terms for the past 70 years. The advantages of this uninterrupted steel trade helped provide seamless steel supply, lower material costs to steel consuming sectors like construction and automotive, and affordable products for consumers. In the last couple of years, the global steel industry has witnessed many trade restriction and safeguards imposed by various economies.
According to the World Trade Organisation, the number of antidumping duty orders in force on specific countries’ steel exports has been rising by around 10% a year since 2012. In 2018, the US imposed a 25% tariff on steel imports. In response, the European Union and Canada moved to safeguard their own producers from a surge in steel imports. Though these safeguards have bolstered production and capacity utilisation in the domestic industry, they have had a negative impact on the sectors like construction, automotive, and infrastructure.
Steel prices have risen, thereby raising material costs for some industries with no added room to pass on the cost to consumers. Moreover, they have created uncertainties and discouraged companies from signing long-term contracts. As for foreign suppliers, they have become less competitive in Iucrative steel markets, impacting their profit margins.
These restictive measures are needed to safeguard the interests of domestic producers, but they need to be implemented with a view to not completely stonewall quality producers and the focus should be to maintain a level-playing field.
The actions have also driven global steel manufacturing companies to put in place robust risk mitigation strategies and incorporate agility in operations to meet temporary headwinds and create opportunities of growth.
Infrastructure boost in Union Budget (interim) FY 2019-20:
- Infrastructure sector was allocated `4.56 lakh crore.
- Communications was allocated `38,637 crore to develop post and telecommunications departments.
- Indian Railways was allocated `66.77 billion; of this, `64.59 billion was set aside for capital expenditures.
- `83,016 crore was allocated towards road transport and highways.
- `3,899 crore to increase capacity of Green Energy Corridor Project along with wind and solar power projects.
- `8,350 crore to boost telecom infrastructure.
2.2.1 RAW MATERIALS
2.2.1.1 Iron ore
The central government auctioned 19 iron ore mines, which will benefit the Indian steel industry by lowering its dependence on iron ore imports.
In FY 2018-19, iron ore imports surged 157% y-o-y in the ninemonth period to 11.5 MnT. However, from August 2018, due to the strengthening of the US$, the spreads between landed costs and domestic iron ore prices narrowed. Consequently, the volume of iron ore imports also softened.
In India, iron ore prices mirror the global trend, which peaked at US$88/tonne in January and February 2019, its highest since August 2014, due to concerns about supply disruptions. However, the strengthening of the US$ narrowed the spread between landed costs and domestic iron ore prices, contributing to a fall in imports. Domestic iron ore production is expected to rise by 2-5%, which should be sufficient to meet domestic demand. However, this needs to be supported with measures that prioritise domestic consumption over exports.
2.2.1.2 Coal
The steel industry has two categories of coal requirement – coking coal and thermal coal (for captive power plants). Thermal coal requirements are met through domestic production, but coking coal needs to be imported, as the coal available domestically has a higher ash content and a lower calorific value.
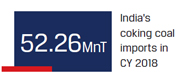
In CY 2018, India imported 52.26 MnT of coking coal, up 14% from 45.93 MnT in CY 2017, primarily driven by the restriction on usage of petroleum coke, an alternative to coal, in some parts of the country.
There is a strong correlation between India’s demand for steel and GDP growth. For example, if GDP growth remains above 5%, steel demand would grow above 5.5%. If GDP growth falls below 5%, steel demand growth would fall below 4%. As India is expected to grow at 6-8% at least for a decade, steel demand is likely to grow at 7%, implying that the country would need to produce an additional 7 MnT of steel. To meet this enhanced demand, the steel sector could see investments to the tune of US$10 billion.
2.2.2 OUTLOOK
Worldsteel forecasts overall steel demand in India to grow above 7% in CY 2019 and CY 2020. Demand is likely to grow to 100-105 MnT, with per capita consumption improving to 75-76 kg, driven by heavy infrastructure spending and faster economic growth. Worldsteel also forecasts that at the current rate, India would overtake the US in terms of demand.
However, India’s steelmakers face persistent threats of cheaper imports and lower domestic prices. The ongoing trade disputes and the global economic slowdown are routing Asian steel inventory to India, negatively impacting the country’s steelmakers. Since, certain trade remedial actions have become irrelevant, imposition of safeguard duty is the need of the hour to stop such imports and corresponding injury to the domestic industry.
The government is likely to take tariff and non-tariff measures to address the issue. It has already asked automakers to cut imports. The list of locally made steel for use in government infrastructure projects is being augmented, along with more stringent quality control norms for all steel products. The government could auction more iron ore mines to increase raw material supply security.
Going forward, India’s steel producers are likely to rely more on robust domestic demand to maintain healthy margins. Margins could also be improved through production of high-end value added steel. The ongoing industry consolidation is expected to drive efficiency.
PERFORMING BETTER. EVERYDAY
In FY 2018-19, JSW Steel achieved its highest-ever crude steel production of 16.69 MnT, up 3% y-o-y. Domestic sales volume grew 11% y-o-y to 13.2 MnT, well above Indian steel consumption growth of 7.5% y-o-y, driven by the increase in market share to 13.6% with primary focus on Southern and Western regions to increase realisations. The higher-margin Value Added and Special Products (VASP) accounted for over 53% of sales volume at 8.3 MnT in FY 2018-19. Sales to the auto sector grew 20%, significantly above the automobile sector growth rate of 6%.
During the year, export markets witnessed a turbulent phase. Weighing the opportunity in India, the Company strategically shifted its focus to domestic markets and maintained its sales momentum. Compared to 77% in FY 2017-18, 85% of the sales were directed at domestic markets in FY 2018-19.
Domestic-export ratio
| Domestic | Exports | |
|---|---|---|
| FY 2018-19 | 85% | 15% |
| FY 2017-18 | 77% | 23% |
3.1 Strategic focus areas
In line with the Company’s philosophy of ‘Better Everyday’, the Company has identified strategic focus areas which will help its continuous improvement journey. These include:
- Increase EBITDA/tonne profitability
- Commissiong of the Coke oven battery at Dolvi through Dolvi Coke Projects Limited to eliminate procurement of coke
- Increase Pulverised Coal Injection (PCI) to reduce coke intake
- Use captive iron ore replacing the high cost imported iron ore
- Diversification of coal procurement basket and optimising coal cost by dynamic coal blend change
- Reduce logistics costs by port optimisation and usage of cape vessels to reduce freight costs
- Build capacities in light of rising steel demand
- A large-scale capex plan initiated
- Both upstream and downstream capacities being augmented
-
Continuously improve the share of VASP in the portfolio
- Focusing on high-tensile, lightweight steel development
- Value engineering to design state-of-the-art steel for automobiles
- Aggressively pursue backward integration with iron ore
mine acquisitions
- Six mines won in the recent auctions and three are operationalised
- More auctions are expected and JSW Steel will proactively participate to derive cost and logistical benefits
- Introduce Industry 4.0 technologies in plant operations
- Appointed a Chief Digital Officer
- Robotics, IoT and sensor-based systems installed
3.2 Product performance
JSW Steel’s best-in-class technology and sustained R&D initiatives help deliver customised and innovative offerings. The Company remained strategically focussed on enriching its product mix by increasing the volume and share of high-margin VASP in its portfolio.
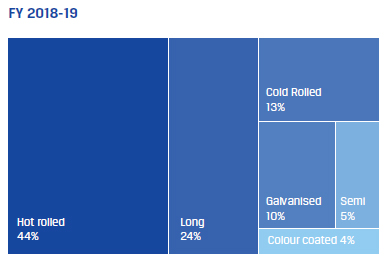
Product mix change year-on-year
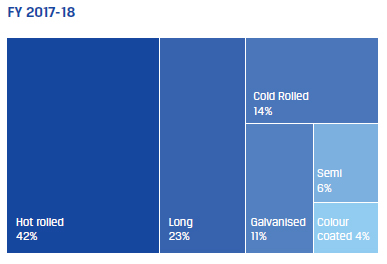
3.2.1 FLATS
JSW Steel produces flat sheet products that include slabs, hotrolled coils, cold-rolled coils and coated products like galvanised, galvalume and colour coated. Flat products maintained a 71% share in the product mix, with domestic growth of 9% y-o-y.
3.2.1.1 Hot rolled
A wide variety of hot rolled (HR) products are manufactured in Hot Strip Mills (HSMs) of Vijayanagar (Karnataka) and Dolvi (Maharashtra). Vijayanagar Works has an installed capacity of 3.2 MTPA and 5 MTPA for HSM-1 and HSM-2, respectively. The capacity at Dolvi Works stands at 3.6 MTPA, where India’s first CONARC process was implemented for steel manufacturing. In FY 2018-19, Hot Rolled Coils (HRCs) constituted 44% of the Company’s product portfolio.
Key sectors
JSW Steel continues to cater to the construction & infrastructure, industrial & engineering, pipes & tubes, automotive, consumer durables and energy sectors with its HR products. During FY 2018- 19, HR domestic sales increased 11% y-o-y.
Product development
| Sector | Grades | Application |
|---|---|---|
| General Engineering | High Strength Low Alloy (S550MC) | Mobile Equiment (Boom and Spreader) Seat Recliner Plate (Cars) |
| Automotive | High Strength Low Alloy (HS 800) | Long member (for HCVs) |
3.2.1.2 Cold Rolled
Cold rolled (CR) steel products are manufactured at Vijayanagar Works. The CR products segment has a 13% share in the total product mix, and witnessed an overall domestic growth of 12% y-o-y.
Key sectors
Cold rolled products in India are majorly consumed by the automotive, industrial and engineering sectors.
3.2.1.3 Electrical steel
Electrical steel finds application across sectors such as electric motors, generators, nuclear power stations, power generation plants, domestic appliances, transformers and automotive electricals. Electrical steel sales increased by 17% y-o-y driven by consumer durables, heavy industrial motors and traction motors.
Product development
| Sector | Grades | Application |
|---|---|---|
| Electrical Lamination | 35C270 | Transformer |
| Electrical Lamination | 35C270 | Generator |
3.2.1.4 Galvanised
JSW Steel is the largest manufacturer and exporter of galvanised steel in India, and the first supplier of products with higher coating (550 gsm) to the solar sector in the country.
Galvanised products comprised 10% of the product portfolio in FY 2018-19. The product is differentiated with features like high strength, resistance to corrosion, eco-friendly, durable and lightweight.
Key sectors
Galvanised products in India are largely consumed by the construction and infrastructure sectors, and consumer durables, appliances, panel and duct manufacturers. In FY 2018-19, sales to the solar sector was nearly 64 KT.
Product development
| Sector | Grades | Application |
|---|---|---|
| Automotive | JAZ (JAC270D)
IS15961 YS 350 |
Outer body
panel Bus body stretch panel |
| General Engineering | High Strength (S350GD) Z600 (600 GSM Zinc coating) | Food grain silo |
3.2.1.5 Colour Coated
Colour coated products comprised 4% of the product portfolio in FY 2018-19, with domestic sales growth of 4% y-o-y.
Key sectors
The overall growth was driven by the construction and rural sector, aided by the Company’s brand building and consumer education drive to identify original JSW coated sheets.
3.2.2 LONGS
JSW Steel manufactures a variety of long products such as TMT bars, wire rods, and special alloy steel. The product segment comprised 24% of the product portfolio in FY 2018-19. During the year, long products’ domestic sales increased by 14% y-o-y.
3.2.2.1 TMT
TMT rebars are manufactured in Vijayanagar Works and Dolvi Works. They comprise 16% of the product portfolio. During the year, total domestic sales volume increased by 16% y-o-y. JSW Neosteel, the TMT brand, increased penetration in the semi urban and rural areas.
Key sectors
JSW Neosteel was used in major projects in the country, ranging from metro rail, Indian Railways, mega housing, aerospace, defence, port and airport, expressway and highway, and critical atomic power. Neosteel also catered to prominent educational institutions, hospitals, IT parks and high rises. JSW Neosteel is the best quality TMT bar range available in India. Manufactured from virgin iron ore in state-of-the-art rolling mills, JSW Neosteel TMT bars are free from impurities and have uniform properties.
3.2.2.2 Wire rods
Wire rods are manufactured at Vijayanagar Works and Salem Works comprising 4% of the product portfolio with domestic sales growth of 8% y-o-y.
3.2.2.3 Alloy steel
Alloy steel products are manufactured at JSW Salem Works. The Company is the largest domestic producer of spring steels flats, alloy steel rounds and bars, alloy steel wire rods and spring steel flats.
3.3 Retail initiatives
JSW Steel has over 9,500 retail outlets, covering 575 districts across India, making it one of the largest retail steel networks in the country. The Company also engages with over 26,700 influencers annually in over 3,000 meets. To exhibit JSW Steel’s product capabilities, the Company participated in more than 30 conferences and exhibitions.
3.3.1 BRAND BUILDING
The Company has been undertaking focussed brand-building initiatives on JSW Neosteel (TMT Bars), JSW Colouron+ and JSW Pragati (Colour Coated), JSW Vishwas (GC Sheets), JSW Galveco (Lead free GC sheet) and JSW Everglow (Color Coated).
JSW Retail facilitates marketing and selling of steel products, including flat products (coated steel products) and long products (TMT). JSW Retail was created to renew focus on branded products, network expansion and strengthen feet-on-the-street presence.
JSW Colouron+ continued to be the leading Color Coated Brand in the country by market share. The Company undertook a large-scale influencer awareness campaign to educate them on identifying genuine products and launched an advertisement campaign across regional channels to create awareness about the brand.
JSW Galveco is a customised, lead-free galvanised steel which is RoHS (Restriction of Hazardous Substances) compliant. This brand caters to appliances customers looking for environment friendly and quality steel.
3.3.2 CUSTOMER CONNECT
JSW Steel shares a strong bond with its customers. To strengthen and celebrate this bond, an OEM customer meet was organised at Hyderabad and an annual channel conference for JSW Shoppe Connect dealers was organised in Jaipur and Kochi. These events served as a platform for the dealers to network and discuss market dynamics and challenges. A Coated OEM customer meet was organised in Pune. They were given a virtual tour of the Vijayanagar plant to showcase the plant’s innovative technologies.
3.3.2.1 Awards from OEM customers
- JSW Steel received a Certificate of Appreciation from the global auto major Toyota Kirloskar, for meeting all quality standards for CY 2018.
- JSW Steel received a certificate of appreciation from Honda for Outstanding Support in Sales Promotion.
- JSWSCPL received award from IFB for outstanding support.
- JSWSCPL received Best Supplier Award from Samsung.
- JSWSCPL received award from LG for outstanding support.
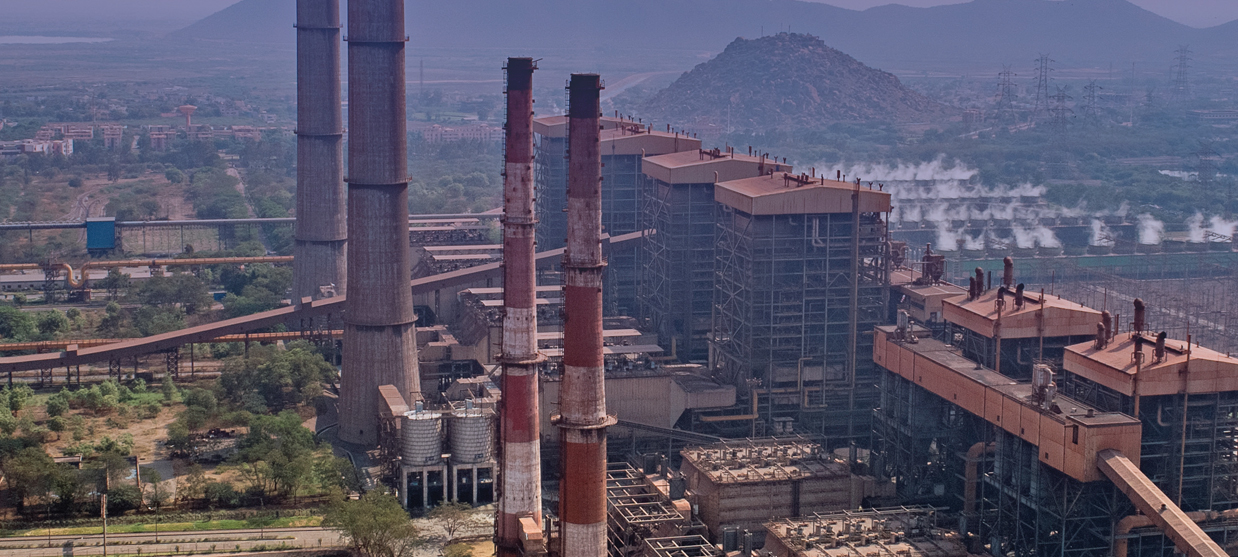
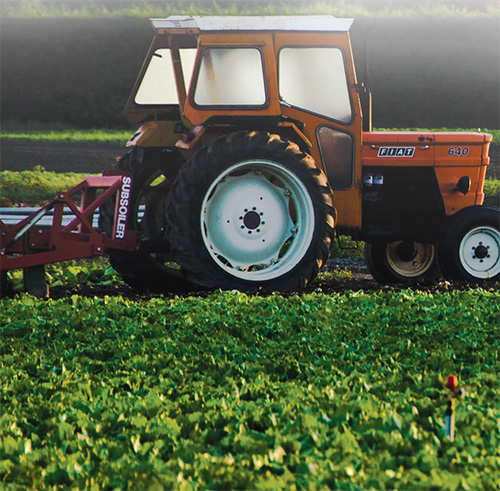
4.1 Vijayanagar Works
JSW Vijayanagar Works is the world’s sixth largest steel plant with an installed capacity of 12 MTPA. The plant is one of the world’s most efficient in terms of conversion cost.
4.1.1 KEY FEATURES
1. Location advantage
JSW Vijayanagar Works is located 380 kilometres from Bengaluru at the Toranagallu village in North Karnataka, in the Bellary-Hospet iron ore belt. It is well-connected to the Goa and Chennai ports. It is a fully integrated steel plant with a well-developed township. The Company won six iron ore mines in open auctions and Vijayanagar is directly connected to those mines.
2. Technologically adept
Vijayanagar Works uses state-of-the-art technology to optimise its operations, profitability per tonne and environmental footprint. Some of them are:
- Ambient air control temperature: To create the toughest, most durable steel
- Corex technology: Used for high smelting intensity and hence high productivity for steel and hot metal production
- Pair-cross technology: To minimise thrust force and wear between contacting work roll and back up roll
- KR process adoption: Uses lime-based desulphurisation to lower sulphur level and meet customers’ demand that requires less than 20ppm of sulphur in their operations
3. Robust logistics management
Being India’s largest single location integrated steel plant, Vijayanagar Works engages in heavy logistics activity, both inbound and outbound. In fact, the Vijayanagar logistics team handles the highest volumes in a single location steel plant in India.
4.1.2 HIGHLIGHTS OF FY 2018-19
1. Location advantage
- Achieved highest-ever hot metal production, with Blast Furnace (BF)-4 producing 3.54 MTPA, the highest by any furnace in India.
- Attained the highest-ever flat steel production; Mill-3 produced 5.05 MTPA.
- Optimised operating cost through key initiatives
like:
- Increase in Pulverised Coal Injection (PCI) in furnaces, thus replacing the need for high priced coke.
- Optimised coke oven blend with the introduction of coke fine.
- Process improvements which reduced coke fine generation.
- Continued focus on environmental initiatives led to lower-than-target energy consumption.
- Strict adherence to safety standards and improved employee awareness reduced the lost time injury frequency rate (LTIFR) to 0.28.
- JSW Steel signed a long term tariff contract (LTTC) with the South Western Railways (for Vijayanagar, Dolvi and Salem Works).
Deming Award for Vijayanagar Works
The Deming Prize was given to nine organisations globally in CY 2018 for outstanding practices in managing continuous improvements across functions. JSW Steel was one of the proud recipients for Vijayanagar Works.
The following factors contributed to winning the Award:
- Indigenously developed TQM framework and governance structure
- Indigenously developed capability development framework for enhancing human resource capability, leading to enhanced motivation levels of employees
- New product development system, reuse of water and technologies to proactively recycle waste, boosted by human resource development
- Proactive deployment of CSR activities to bring benefit to the local society under the ‘create economic value by creating social value’ policy
Programmes that received commendation during the Deming Prize assessment:
- 0757: A shop-floor mantra to engage all employees to the common goal of 0 Injury, 0 Defect, 0 Breakdown and 0 Incidents, by eliminating 7 industrial wastes, institutionalising 5S, by using 7 basic problem-solving tools
- 4i: A unique problem-solving methodology
- 4iJ3: A capability building programme for creating Change Leaders for the future. The programme creates individual plan to develop problem-solving capability by training them on statistical analysis tools while providing training on managerial and interpersonal skills
- 8S: An employee engagement programme that covers communication, training and development, problem solving, reward and recognition, and knowledge management
- J1+ : A capability building programme for frontline employees

4.1.3 KEY PROJECTS
Vijayanagar Works witnessed the development of the following key projects during FY 2018-19:
Commissioned
- Operationalised three iron ore mines acquired as part of the iron ore auction process, this is in line with the backward integration strategy to source iron ore locally.
- In order to transport iron ore from the mine to the plant, JSW Steel installed a 24 km-long pipe conveyor belt. This has helped the Company ensure that there is no spillage of raw material while eliminating the need for diesel trucks for transportation, which has further lowered the Company’s environmental footprint and minimised road accidents.
- A new Water Reservoir of 1.3 TMC storage capacity ensures adequate supply of water for uninterrupted operations of the plant, mitigating an operational risk as Vijayanagar is a water-scarce region.
- A Tailing Beneficiation plant which helps reduce tailing losses and improves iron content in the feed to Pellet and Sinter plants.
- Additional Coal Injection system and relining of Stove #4 part of BF-3 has helped reduce fuel consumption substantially.
Under implementation
- Downhill conveyors from newly acquired mines up to the ore yard and remaining segments of the pipe conveyor system to ensure improved connectivity and seamless transport of raw material.
- Coke drying unit at BF-1 to reduce coke moisture utilising waste heat from Sinter Plant-1 off gases.
- A new Cut to Length (CTL) line to meet demand of sized steel products.
- Addition of a new 160T Zero Power Furnace and 1 x 1.4 MTPA Billet Caster along with associated facilities at SMS-3 to enhance steelmaking capacity to 13 MTPA.
4.1.4 CAPACITY EXPANSION ROADMAP
1. Capacity augmentation to 13 MTPA
Objective: Upgrade BF-3 capacity to 4.5 MTPA hot metal, enhance SMS capacity, augment existing HSM and Wire Rod Mills to support enhanced BF-3 capacity
Expected commissioning: March 2020
2. CRM-1 complex capacity expansion
Objective: CRM-1 complex capacity will be increased from 0.85 MTPA to 1.80 MTPA along with two Continuous Galvanising Line of 0.45 MTPA each, a new 1.2 MTPA Continuous Pickling Line for HRPO products
Expected commissioning: March 2020
3. Cost reduction projects and manufacturing integration
Objective: Integrate manufacturing processes at Pellet plant (8 MTPA) and Coke oven battery (1.5 MTPA)
Expected commissioning: March 2020
4.1.5 R&D INITIATIVES IN FY 2018-19
The Company enhanced existing processes and developed new ones to reduce overall costs, maximise quality, optimise energy and utilise wastes.
- Implemented predictive model in COREX furnaces to maximise metallisation and improve productivity
- Developed heat balance model in Blast Furnace 3 and 4 to optimise fuel consumption and improve process efficiency.
- Developed chemical reagent to improve bentonite binder properties to reduce binder consumption.
- Optimised pre-heating temperature of pellet plant to reduce cracks, improve pellet strength and increase pellet productivity.
4.1.6 LOOKING FORWARD
Vijayanagar Works has set out a robust future road map to achieve an even higher operational efficiency in FY 2019-20. Given below are select focus areas where work is ongoing.
- Higher emphasis on Green initiatives during technology upgrades.
- Implementing technologies that utilise the least amount of water.
- More collaborative efforts with academic institutes to address pressing needs such as devising methods to capture CO2 and convert to useful fuels and to convert non-coking coal to coking coal.
- Generate applications to create wealth from wastes.
- The Company has also planned logistics projects, which
include:
- A Logistics Control Room to act as the central controlling node for all logistics – inbound, in-plant and outbound.
- RFID for yard management will enable 100% visibility of finished goods inventory movement
- Electrification of railway yards for faster operations.
- Road Trans Hub that can handle up to 5 MTPA road dispatches at plant boundary to nearly eliminate in-plant truck movements and ensure a quicker turnaround.
- European design for steel loading – first ever in India to reduce damage rate and improve dispatch efficiency.
4.1.7 PRIORITIES FOR FY 2019-20
- Operationalisation of the remaining mines acquired as part of the iron ore auction process to secure 20% of the iron ore requirements.
- Commissioning of the downhill conveyors from newly acquired mines up to the ore yard and remaining segments of the pipe conveyor system to ensure improved connectivity and seamless transport of raw material.
- Sustained usage of PCI to reduce coke usage.
- Successful completion of capacity expansion to 13 MTPA.
- Participation of iron ore and coal mines auction to ensure sustained raw material availability for manufacturing.
4.2 Dolvi Works
The 5 MTPA integrated steel plant at Dolvi is advantageously located on the West coast of Maharashtra. The plant is connected to a jetty that can handle cargo of up to 15 MTPA. JSW Dolvi Works is India’s first steel plant to adopt a combination of Conarc Technology for both steel-making and compact strip production (CSP), aiding production of HR coils.
The facility is undergoing a large-scale ramp-up to double its steel production capacity. Dolvi is the only primary producer of long products in Western India. A substantial quantity of HR coils produced in Dolvi is sent to JSW’s downstream facilities for value addition.
4.2.1 HIGHLIGHTS OF FY 2018-19
- Eight new grades were developed/customised at Dolvi.
- Cost-effective API (X65 and X70) grade steel through CSP route with impact and DWTT at subzero temperature (up to -40 Degree C) for line pipe application (both sweet and sour).
- Billets for E450 grade TLT angle and E350 grade TLT angle with impact properties at -40 Degree C.
- Replaced damaged ducts in Sinter Plant-1, leading to improved collection of dust emissions during material handling.
- Raw Material Yard concreting was done to control material loss and to avoid moisture pick up.
4.2.2 KEY PROJECTS
Commissioned
- Digitalisation initiatives to reduce set up time for processes and thus improve productivity of SMS.
- Installation of cameras to capture the timing of processes in SMS. The cameras help in capturing delays and in identifying reasons for the delays.
Under implementation
- 175 MW WHRB and 60 MW captive power plant (CPP) to harness flue gases and steam from Coke Dry Quencher (CDQ).
- Coke Projects Phase 2: Second line of 1.5 MTPA coke oven battery along with CDQ.
4.2.3 R&D INITIATIVES IN FY 2018-19
- Optimisation of green pellet arrangement and process
parameters in lab scale muffle furnace to simulate plant
scale process.
Outcome: Development of critical R&D infrastructure which will be useful for future research projects. - Maximisation of FMG percentage in sinter feed mix. Outcome: Resulted in better knowledge regarding usage of low grade high goethetic iron in sinter.
- Mathematical model developed for predicting temperature history and phase transformation occurring in TMT rebar during QST process. Outcome: Optimising process parameters of BRM and developing new grade of TMT rebars.
4.2.4 CAPACITY EXPANSION
- By March 2020, JSW Steel Dolvi Works is expected to commission operations at double its current capacity. The expansion project is notable for being undertaken at a rapid pace within a limited available land area.
- The capacity expansion would install a 4.5 MTPA Blast Furnace with a 5 MTPA Steel Melt Shop and a 5 MTPA Hot Strip Mill. The plant would also have a 5.75 MTPA sinter plant, a 4 MTPA pellet plant and 4 kilns of 600 TPD LCPs.
4.2.5 LOOKING FORWARD
- Successful completion of capacity expansion to 10 MTPA.
- Continued focus on conservational initiatives and incorporation of new technologies that can reduce environmental footprint. Emissions will be made compliant not just with the local regulations, but also with European standards.
- Focus on safety to reduce untoward incidents and cap LTIFR to 0.3.
4.2.6 PRIORITIES FOR FY 2019-20
- Successful completion of capacity expansion to 10 MTPA.
- Sustained usage of PCI in blast furnace to reduce coke usage.
4.3 Salem Works
JSW Salem Works is located at the strategic crossroads of Chennai and Bangalore. Well connected to railways, ports and highways, this facility manufactures virgin special steel products and supplies primarily to the automobile sector. Producing more than 850 special grades of steel, Salem Works is the largest homegrown special steel plant with a 1 MTPA capacity.
Crucial technology processes and energy utilisation systems sets the Salem facility apart. It is one of few plants to use Energy Optimising Furnace (EOF) to produce steel, use waste heat to generate more than 70% of captive power, utilise 100% of its wastes and use phased array technology to detect internal defects. For Salem, FY 2018-19 was a year of major environmental initiatives to drive operational excellence.
4.3.1 HIGHLIGHTS OF FY 2018-19
A total of 13 new grades were developed at Salem Works for various applications including automotive, gear, textile carding, rock drill and agricultural utility. Three of them are industry firsts, developed by the in-house R&D team.
In terms of intellectual property, the plant accomplished the following:
- Process development for making paver blocks from steelmaking slags.
- Control of macro inclusions in micro alloyed steel through process modifications.
- Low temperature deformation of carbon steel, micro alloyed steels and high carbon steels slags.
4.3.2 KEY PROJECTS
Commissioned
- Implemented de-dusting systems at various areas to keep emissions in check.
- Developed tyre washing unit to control dust generated through truck movement.
- Installed third billet grinding machine to improve surface finish of billets for cold head quality and free cutting steels.
- Commissioned BF-1 Stove to maintain higher hot blast temperature, thereby reducing fuel costs.
- Augmented Sinter Plant-2 capacity to increase agglomerated burden in blast furnace.
4.3.3 LOOKING FORWARD
Salem Works will focus on the following areas:
- Install a conveyor system to handle raw materials from wagon tippler.
- Build MPI Inspection facilities with grinding station at Line 04.
- Implement liquid oxygen backup system for emergency supply of oxygen to SMS.
- Create oxygen facility for increasing oxygen enrichment in blast furnace.
5.1 Standalone
For the steel industry, the year began with a strong underlying demand and rising international prices, which resulted in higher spreads and ensured better profitability. However, towards the second half, on-going trade disputes between US and China and slowdown across some of the developed economies, led to softening of the prices and demand for steel globally. Despite the headwinds, global steel demand expanded 2.1% in 2018.
Cash flows and profitability in FY 2018-19 was driven by stronger steel spreads, as the increase in finished steel products prices was higher than the increased price of principal raw materials like iron ore and coking coal.
In the first half of FY 2018-19, the demand for steel remained positive owing to continued government spending on infrastructure. Towards, the last two quarters, activities surrounding the national election led to restrained investment activity. However, the domestic demand for steel during FY 2018-19 sustained a growth and increased by 7.5%. Steel imports increased by 4.7% specifically in coated products. However, steel exports from India reduced by 26.4%, due to subdued international demand and various trade measures. Higher spreads during the year, was on back of robust steel demand in the domestic markets and the benign macro-economic activities.
In this competitive environment, the Company continued to increase the market share in the domestic market by strategically focusing on increasing domestic sales volume.
This robust domestic demand, focussed cost reduction, backward integration and healthy mix of value added portfolio helped the Company deliver strong operational and profitable performance during FY 2018-19.
5.1.1 HIGHLIGHTS OF FY 2018-19
| 2018-19 | 2017-18 | Change | |
|---|---|---|---|
| Revenue from operations | 76,727 | 67,723 | 13% |
| Other income | 519 | 213 | 144% |
| Operating EBITDA | 18,403 | 13,741 | 34% |
| Operating EBITDA margin (%) | 24% | 21% | 16% |
| Depreciation and amortisation expense | 3,397 | 3,054 | 11% |
| Interest expenses | 3,708 | 3,591 | 3% |
| Profit before exceptional Items | 11,817 | 7,309 | 62% |
| Exceptional items | - | 234 | -100% |
| PAT | 8,259 | 4,625 | 79% |
JSW Steel reported its highest-ever production, shipments, revenue and EBITDA during FY 2018-19. The Company produced 16.69 MnT of crude steel, up 3% y-o-y. Production volume was higher by 3% with the Vijayanagar and Salem units achieving higher utilisation levels. Overall capacity utilisation was 93%.
Revenues increased 13% y-o-y to `76,727 crore, primary due to higher realisations. The Company’s saleable steel volume grew by 1% y-o-y to 15.76 MnT with domestic sales volume growth at 10% outpacing India’s overall steel consumption growth of 7.5%.
The Company reduced costs by switching to secondary benchmarks for coal, strategic switch to low Fe imported iron ore, operationalising three iron ore mines and utilising captive iron ore, and increasing usage of PCI coal in blast furnace to reduce fuel consumption.
The increased realisations and cost optimisation initiatives helped the Company report an operating EBITDA of `18,403 crore, up 34% y-o-y, operating EBITDA margin of 24%, and net profit after tax of `8,259 crore.
Net gearing was at 1.03 as on 31 March 2019 (vis-à-vis 1.27, as on 31 March 2018) and Net Debt to EBITDA stood at 1.97x as on 31 March 2019 (as against 2.59x as on 31 March 2018).
5.1.2 REVENUE ANALYSIS
(` in crore)
| 2018-19 | 2017-18 | Change | Change % | |
|---|---|---|---|---|
| Domestic Turnover | 66,841 | 54,869 | 11,972 | 22% |
| Export Turnover | 7,928 | 11,366 | (3,438) | -30% |
| Total Turnover | 74,769 | 66,235 | 8,534 | 13% |
| Other Operating Revenues | 1,958 | 1,488 | 470 | 32% |
| 76,727 | 67,723 | 9,004 | 13% |
Product wise quantity break-up (Mt)
| 2018-19 | 2017-18 | % Growth | |
|---|---|---|---|
| Products Rolled products – Flat |
11.29 | 11.17 | 1% |
| Rolled products – Long | 3.69 | 3.55 | 4% |
| Semis | 0.78 | 0.90 | -13% |
| Total Saleable Steel | 15.76 | 15.62 | 1% |
Saleable steel sales volume for the year grew by 1% y-o-y to 15.76 MnT, driven by domestic sales.
Revenue from operations for FY 2018-19 stood at `76,727 crore, up 13% y-o-y. This revenue was mainly driven by higher average realisations on the back of improved price realisations.
JSW Steel continued to improve its market share as domestic sales surged to 13.9 MnT in FY 2018-19, an increase of 10% y-o-y compared to 7.5% y-o-y increase in Indian steel demand.
During the year, export markets witnessed a turbulent phase. Weighing the opportunity in India, JSW Steel strategically shifted its focus to domestic markets and maintained its sales momentum. Compared to 77% in FY 2017-18, 85% of the sales were contributed by the domestic markets in FY 2018-19.
Other operating revenue was higher by `470 crore compared to FY 2017-18, primarily due to higher incentive benefits recognised in FY 2018-19 due to upward revision in incentive rates in the GST regime as compared to the previous year where the incentive benefits was recognised only for a period of nine months and increase in regional sales and realisations.
5.1.3 OTHER INCOME
(` in crore)
| 2018-19 | 2017-18 | Change | Change % | |
|---|---|---|---|---|
| Other Income | 519 | 213 | 306 | 144% |
Other income was higher primarily due to the receipt of dividend income from its subsidiaries and increase in interest dividend income from subsidiaries.
5.1.4 MATERIALS
(` in crore)
| 2018-19 | 2017-18 | Change | Change % | |
|---|---|---|---|---|
| Cost of materials consumed (including changes in inventories of finished goods and work in progress) | 39,899 | 37,470 | 2,429 | 6% |
The Company’s expenditure on material consumption increased 6% y-o-y to `39,899 crore on account of a 3% increase in production volumes and increase in raw material prices, especially iron ore and coal, and the impact of an unfavourable local currency movement on imported raw materials.
5.1.5 EMPLOYEE BENEFITS EXPENSES
| 2018-19 | 2017-18 | Change | Change % | |
|---|---|---|---|---|
| Employee remuneration and benefits | 1.400 | 1,260 | 140 | 11% |
Employee benefits expenses increased by 11% y-o-y to `1,400 crore, largely due to annual increase in compensation for employees and increase in headcount to 12,599 employees at end-March 2019, from 11,619 employees at end-March 2018.
5.1.6 MANUFACTURING AND OTHER EXPENSES
| 2018-19 | 2017-18 | Change | Change % | |
|---|---|---|---|---|
| Other Expenses | 17,025 | 13,993 | 3,032 | 22% |
Manufacturing and other expenses increased 22% y-o-y to `17,025 crore, primarily due to an increase in power and fuel cost, stores and spares consumption, and hedging cost. Power and fuel cost increased 20% y-o-y by `975 crore on account of additional power purchases and higher steam coal prices. Stores and spares consumption increased by 35%, largely due to an increase in prices of electrodes and refractories. The hedging cost was higher as the Company covered its exposures largely through forwards.
5.1.7 FINANCE COST
| 2018-19 | 2017-18 | Change | Change % | |
|---|---|---|---|---|
| Finance Cost | 3,708 | 3,591 | 117 | 3% |
Finance cost increased by 3% y-o-y to `3,708 crore. The margin increase in finance cost was primarily due to increased working capital requirements, which was driven by a rise in inventories owing to increase in key inputs and receivables. Overall, a tighthened liquidity scenario, higher steel prices and blockage of Government receivables, all led to a rise in finance cost. Total borrowings as on 31 March 2019 stood at `41,937 crore, up from `36,181 crore, as on 31 March 2018.
5.1.8 DEPRECIATION AND AMORTISATION
(` in crore)
| 2018-19 | 2017-18 | Change | Change % | |
|---|---|---|---|---|
| Depreciation and amortisation | 3,397 | 3,054 | 343 | 11% |
Depreciation and amortisation increased 11% y-o-y to `3,397 crore due to additional depreciation on asset capitalisation for new projects and normal capex. Accelerated depreciation was charged on certain assets discarded / to be discarded due to expansion / modification / setting up of new facilities.
5.1.9 EXCEPTIONAL ITEMS
(` in crore)
| 2018-19 | 2017-18 | Change | Change % | |
|---|---|---|---|---|
| Exceptional items | - | 234 | (234) | -100% |
There were no exceptional items during FY 2018-19. A subsidiary of the Company surrendered one of its iron ore mines in Chile in FY 2017-18 considering its economic viability. Accordingly, the Company reassessed the recoverability of loans to and investments made and recognised an impairment provision of `234 crore, disclosed as an exceptional item in the previous year.
5.1.10 TAX EXPENSE
Tax expense increased to `3,558 crore in FY 2018-19 from `2,450 crore in FY 2017-18 primarily on account of higher tax provisions due to an increase in profit before tax during the current year. The effective tax rate decreased to 30.11% from 34.63%, primarily due to the availment of certain tax incentives in FY 2018-19.
5.1.11 PROPERTY, PLANT AND EQUIPMENT
(` in crore)
| 2018-19 | 2017-18 | Change | Change % | |
|---|---|---|---|---|
| Tangible assets | 49,245 | 49,503 | (258) | -1% |
| Capital work-in-progress | 9,577 | 3,071 | 6,506 | 212% |
| Intangible assets | 172 | 65 | 107 | 165% |
| Intangible assets under development | 344 | 321 | 23 | 7% |
| Total | 59,338 | 52,960 | 6,378 | 12% |
Net block of Property, Plant and Equipment increased by `6,378 crore primarily on account of capital expenditure for capacity expansion from 5 MTPA to 10 MTPA at Dolvi and investments in CRM-1 expansion at Vijayanagar and other capacity augmention and cost-saving projects.
5.1.12 INVESTMENTS
(` in crore)
| 2018-19 | 2017-18 | Change | Change % | |
|---|---|---|---|---|
| Investments in subsidiaries, associates and joint ventures | 4,853 | 3,848 | 1,005 | 26% |
| Other Investments | 1,424 | 1,030 | 394 | 38% |
| 6,277 | 4,878 | 1,399 | 29% |
The increase in investments was primarily due to acquisitions made during the year. The Company invested `536 crore in Acero Junction Holding Inc. in June 2018, `399 crore in Creixent Special Steels Limited for investing in Monnet Ispat and Energy Limited in August 2018 and `359 crore in its subsidiary Dolvi Mineral and Metals Private Limited.
5.1.13 LOANS AND ADVANCES
(` in crore)
| 2018-19 | 2017-18 | Change | Change % | |
|---|---|---|---|---|
| Long-term loans and advances | 7,674 | 5,165 | 2,509 | 49% |
| Short-term loans and advances | 136 | 158 | (22) | -14% |
| Total | 7,810 | 5,323 | 2,487 | 47% |
Loan and advance increased primarily due to loans provided to certain overseas subsidiaries for acquisitions, working capital, capital expenditure and other general corporate purposes.
5.1.14 OTHER FINANCIAL ASSETS
(` in crore)
| 2018-19 | 2017-18 | Change | Change % | |
|---|---|---|---|---|
| Non-Current Other Financial Assets | 45 | 746 | (701) | -94% |
| Current Other Financial Assets | 2,621 | 503 | 2,118 | 421% |
Decrease in non current other financial assets is primarily due to reclassification of certain receivable of subsidiaries to current other financial assets. Current other financial assets increased primarily due to non receipt of GST incentive benefits recognised during the year and previous years.
5.1.15 OTHER NON-FINANCIAL ASSETS
(` in crore)
| 2018-19 | 2017-18 | Change | Change % | |
|---|---|---|---|---|
| Other Non Current Assets | 3,364 | 2,299 | 1,065 | 46% |
| Other Current Assets | 1,999 | 3,070 | (1,071) | -35% |
Other non-current assets increased by `1,065 crore primarily due to an increase in capital advances for projects being executed. Other current assets decreased primarily due to decrease in advances given to suppliers.
5.1.16 INVENTORIES
(` in crore)
| 2018-19 | 2017-18 | Change | Change % | |
|---|---|---|---|---|
| Raw Materials | 4,975 | 4,774 | 201 | 4% |
| Work-in-Progress | 476 | 690 | (214) | -31% |
| Semi Finished/ Finished Goods | 3,229 | 2,826 | 403 | 14% |
| Production Consumables and Stores & Spares | 1,919 | 1,792 | 127 | 7% |
| Total | 10,599 | 10,082 | 517 | 5% |
The average inventory holding as on 31 March 2019 for finished goods was unchanged at 20 days. However, overall inventory holding fell to 66 days for FY 2018-19 from 70 days a year earlier. Value of inventories increased by 5% due to higher cost of raw materials like coal and iron ore and spares.
5.1.17 TRADE RECEIVABLES
(` in crore)
| 2018-19 | 2017-18 | Change | Change % | |
|---|---|---|---|---|
| Total Debtors | 6,828 | 4,770 | 2,058 | 43% |
| Less: Provision for Doubtful debts | (82) | (78) | (4) | 5% |
| Trade Receivables | 6,746 | 4,692 | 2,054 | 44% |
The average collection period as on 31 March 2019 was 33 days, up from 26 days as on 31 March 2018, primarily on account of increase in steel prices FY 2018-19 and extended credit due to stressed liquidity conditions.
5.1.18 BORROWINGS
(` in crore)
| 2018-19 | 2017-18 | Change | Change % | |
|---|---|---|---|---|
| Long Term Borrowings | 26,748 | 29,551 | (2,803) | -9% |
| Short Term Borrowings | 5,368 | 2,172 | 3,196 | 147% |
| Current Maturities - Debt | 9,404 | 4,099 | 5,305 | 129% |
| Current Maturities - Finance Lease | 417 | 359 | 58 | 16% |
| Sub Total | 41,937 | 36,181 | 5,756 | 16% |
Long-term borrowings (including current maturity of long term debt) increased by `2,560 crore mainly due to availment of new loans for capacity expansion projects.
5.1.19 TRADE PAYABLES
(` in crore)
| 2018-19 | 2017-18 | Change | Change % | |
|---|---|---|---|---|
| Acceptances | 8,926 | 8,098 | 828 | 10% |
| Other than acceptances | 4,126 | 5,890 | (1,764) | -30% |
| Total trade payables | 13,052 | 13,988 | (936) | -7% |
Trade payables decreased by 7% primarily due to decrease in imported raw material creditors.
5.1.20 OTHER FINANCIAL LIABILITIES
(` in crore)
| 2018-19 | 2017-18 | Change | Change % | |
|---|---|---|---|---|
| Other Non Current Financial Liablities | 1,015 | 698 | 317 | 45% |
| Other Current Financial Liabiities (excluding current maturities of long term borrowings and finance lease obligations) | 3,965 | 2,653 | 1,312 | 49% |
Increase in other non current financial liabilities is primarily due to increase in retention money for capital projects. Other current financial liabilities (excluding current maturities of long term borrowings and finance lease obligations) has increased mainly due to increase in payable for capital projects.
5.1.21 CAPITAL EMPLOYED
Total capital employed increased by 11% from `65,986 crore as on 31 March 2018 to `73,098 crore as on 31 March 2019.
Return on capital employed was at 21.6% for FY 2018-19.
5.1.22 OWN FUNDS
Net worth increased from `27,907 crore as on 31 March 2018 to `35,162 crore as on 31 March 2019.
The book value per share was `145.47 as on 31 March 2019 as against `115.45 as on 31 March 2018.
5.1.23 OTHER KEY FINANCIAL INDICATORS
| Ratios | 2018-19 | 2017-18 | Change | Change % |
|---|---|---|---|---|
| Debtors Turnover (no. of days)* | 33 | 26 | 7 | 26.9% |
| Inventory Turnover (no. of days) | 66 | 70 | (4) | -5.7% |
| Interest Coverage Ratio** | 5.40 | 4.05 | 1.35 | 33.3% |
| Current Ratio | 0.81 | 0.76 | 0.05 | 6.6% |
| Debt Equity Ratio | 1.19 | 1.30 | (0.11) | -8.5% |
| Operating EBITDA Margin (%) | 24.0% | 20.7% | 3.3 | 16.0% |
| Net Profit Margin (%)^ | 10.8% | 7.0% | 3.80 | 54.3% |
| Return on Net Worth# | 23.5% | 16.6% | 6.90 | 41.6% |
Notes:
* Increase was primarily on account of increase in steel prices in FY 2018-19 and extended credit due to stressed liquidity conditions
** The increase in Interest Coverage Ratio has improved by 33% primarily due to the increase in EBITDA during the year
^ Change in net profit margin is due to increased profitability in FY 2018-19 driven by stronger steel spreads. The EBITDA increased by `4,662 crore (34% increase).
However, the interest and depreciation charge remained at similar levels as compared to previous year.
# Return on Net worth is higher due to increase in profitability in FY 2018-19 by 79%
5.2 Consolidated
The Company reported consolidated revenue from operations, operating EBITDA and net profit after tax of `84,757 crore, `18,952 crore, and `7,524 crore, respectively. The Company’s consolidated financial statements include the financial performance of the following subsidiaries and joint ventures.
5.2.1 SUBSIDIARIES
1. JSW Steel (Netherlands) B.V.
2. JSW Steel Italy S.r.l.
3. JSW Steel (UK) Limited
4. Periama Holdings, LLC
5. JSW Steel (USA), Inc.
6. Purest Energy, LLC
7. Meadow Creek Minerals, LLC
8. Hutchinson Minerals, LLC
9. RC Minerals, LLC
10. Keenan Minerals, LLC
11. Peace Leasing, LLC
12. Prime Coal, LLC
13. Planck Holdings, LLC
14. Rolling S Augering, LLC
15. Periama Handling, LLC
16. Lower Hutchinson Minerals, LLC
17. Caretta Minerals, LLC
18. JSW Panama Holdings Corporation
19. Inversiones Eroush Limitada
20. Santa Fe Mining S.A.
21. Santa Fe Puerto S.A.
22. JSW Natural Resources Limited
23. JSW Natural Resources Mozambique Limitada
24. JSW ADMS Carvão Limitada
25. JSW Steel Processing Centres Limited
26. JSW Bengal Steel Limited
27. JSW Natural Resources India Limited
28. JSW Energy (Bengal) Limited
29. JSW Natural Resources Bengal Limited
30. JSW Jharkhand Steel Limited
31. JSW Steel Coated Products Limited
32. Amba River Coke Limited
33. Nippon Ispat Singapore (PTE) Limited
34. Erebus Limited
35. Arima Holdings Limited
36. Lakeland Securities Limited
37. Peddar Realty Private Limited
38. JSW Steel (Salav) Limited
39. JSW Industrial Gases Private Limited
40. JSW Utkal Steel Limited
41. Hasaud Steel Limited
42. Milloret Steel Limited (till 27 August 2018)
43. Creixent Special Steels Limited (till 27 August 2018)
44. Dolvi Minerals & Metals Private Limited
45. Dolvi Coke Projects Limited
46. JSW Realty & Infrastructure Private Limited
47. JSW Retail Limited (w.e.f 20 September 2018)
48. Acero Junction Holdings, Inc. (w.e.f 13 June 2018)
49. JSW Steel USA Ohio, Inc. (Previously known as Acero Junction Inc.) (w.e.f 13 June 2018)
50. Aferpi S.p.A (w.e.f 24 July 2018)
51. Piombino Logistics S.p.A (w.e.f 24 July 2018)
52. GSI Lucchini S.p.A (w.e.f 24 July 2018)
5.2.2 JOINTLY CONTROLLED ENTITIES:
53. Vijayanagar Minerals Private Limited
54. Rohne Coal Company Private Limited
55. Geosteel LLC
56. JSW Severfield Structures Limited
57. JSW Structural Metal Decking Limited
58. Gourangdih Coal Limited
59. JSW MI Steel Service Center Private Limited
60. JSW Vallabh Tinplate Private Limited
61. Acciaitalia S.p.A. (till 17 April 2018)
62. Creixent Special Steel Limited (w.e.f 28 August 2018)
63. Milloret Steel Limited (w.e.f 28 August 2018 till 31 August 2018)
64. Monnet Ispat & Energy Limited (w.e.f 31 August 2018)
Steel production is an energy-intensive process. However, steel manufacturing processes generally engage exothermic (heatproducing) reactions. The heat from these reactions, if captured well, can be repurposed for energy requirements.
JSW Steel has been at the forefront of optimising its energy usage, which has a direct impact on its bottom-line and also reduces environmental impacts. With the brownfield expansions underway, the Company’s energy requirements are proportionally increasing. The Company has undertaken several initiatives to improve its energy management systems across facilities
JSW Steel Energy Policy
JSW Steel strives for global recognition and excellence by achieving the lowest specific energy consumption and taking proactive steps to combat climate change.
The Company is committed to:
- Continuously improving its energy performance through resource optimisation, deployment of the latest technologies and cost-effective use of energy.
- Driving energy conservation and increasing efficiency of operations through deployment of innovative and reliable processes, which enable effective reuse, recycle and reduction of resources.
- Performing beyond compliance with all the applicable statutory, regulatory and business requirements.
- Training and engaging with relevant stakeholders in building responsible behaviours in usage of energy and facilitating installation of energy efficient plant, equipment and other resources for future expansions
- Harnessing green, clean or renewable energy sources.
6.1 Continuous improvement in energy management
JSW Steel is working towards maximising the available waste heat recovery through implementing best-in-class heat recovery systems, regular audit for process optimisation, increased utilisation of process generated by-product gases and minimise dependency on external purchased fuel. It also endeavours to increase the overall plant efficiency through deployment of total quality management practices, linked to specific energy consumption (SEC) targets. Incentives and key result areas (KRAs) of the senior management and the individual departments are also linked to the energy performance indicators.
With a mission to set a benchmark for other steel plants with regard to carbon footprint reduction and emissions, the Company is investing in extensive green belt development through tree plantation in and around the plants to enable carbon dioxide sequestration and derive other benefits like dust control and better landscape.
JSW Steel has set up a state-of-the-art Energy Management Centre equipped with a supervisory control and data acquisition (SCADA) system that gathers all plant site energy information by remote Programmable Logic Controllers (PLCs) and field instruments. A trained team of engineers works continuously in shifts to optimise real-time distribution of by-product gases generated during the process, considering production and power management. The Company has set a goal of ‘Adaptation of global best available technologies and lowest SEC by 2025.’
Further, the Company has deployed an online software which calculates SEC of a plant on a daily basis. This helps in regular monitoring and subsequent reduction of SEC.
6.2 Initiatives for effective energy management at JSW Steel:
- To promote energy management best practices and reinforce good energy management behaviours, the management implemented ISO 50001.
- The energy coordinators have conducted the following activities:
- Awareness training on requirements on EnMS-ISO 50001:2011 was provided.
- Sequential process flow diagram.
- Identification of significant energy usage.
The process is under implementation and is targeted to be certified by December 2019.
6.3 Vijayanagar Works
Initiatives taken for energy conservation, emissions reduction and results achieved:
6.3.1 ENERGY MANAGEMENT HIGHLIGHTS
- Top recovery turbine power generation is 18.3 MW which fulfils 13.3% of total power consumption requirement of blast furnace
- Substantially increased the BF PCI by reducing solid fuel rate
- Increased LD gas recovery to 98.7 Nm3/TIs
- Commissioned 150 TPH Boiler for power augmentation
- 45.13 TPH of steam generation through sinter cooler waste heat recovery boiler
- Zero coal-fired boilers, 100% by-product gas firing for process steam generation
- Reduction in oxygen venting by 36%
Progress of energy consumption reduction at Vijayanagar Works:
| Year | *SEC, Gcal/Tcs | *CO2, TCO2/Tcs |
|---|---|---|
| 2016-17 | 6.260 | 2.41 |
| 2017-18 | 6.185 | 2.40 |
| 2018-19 | 6.08 | 2.31 |
6.4 Dolvi Works
6.4.1 ENERGY MANAGEMENT HIGHLIGHTS
- Dolvi Works initiated the usage of Coke Oven Gas in place of Natural Gas (NG) in FY 2018-19 at production of Direct Reduced Iron (DRI), Tunnel Furnace, Bar Mill and SMS ladle preheater.
- Fuel conversion of HSM Boiler and BF Cast house from NG to COG leading to NG saving of 672 KSm3.
- Revamping of CPP turbine, identification and arresting of leakages resulting in reduction of gaseous heat rate from 2641 Kcal/nm3 in FY 2017-18 to 2400 Kcal/kwh.
- Interconnection of HP and LP steam network through Pressure Reducing and Desuperheating (PRDS) system to provide steam from Sinter-2 waste heat recovery boiler to Coke oven resulting in steam production @20 TPH.
- Implementation of online air fuel ratio logic at CPP; reduction in CPP gaseous heat rate by 10.6%.
- Fuel conversion of LCP 1, 2 and 3 from solid fuel (coal) to by-product gas (BFG+COG) resulting in reduction of heat rate lower CO2 emissions.
6.5 Salem Works
Specific energy consumption
| Year | Crude Steel lakh MnT | Gcal/TCS |
|---|---|---|
| 2016-17 | 8.2 | 7.24 |
| 2017-18 | 8.4 | 6.94 |
| 2018-19 | 9.7 | 6.95 |
6.5.1 ENERGY MANAGEMENT HIGHLIGHTS
- Lowest-ever specific power consumption per tonne of crude steel and at Sinter plant.
- Highest-ever power generation from waste gases of 36.61 Mw (previous best – 36.51 Mw, FY 2016-17).
6.5.2 ENERGY SAVINGS INITIATIVES AT SALEM WORKS
- Reduction in fuel rate in BF-1 by increasing Hot Blast Temperature after installation of High Temperature Hot Blast Stoves.
- Optimisation of Air Fuel ratio in BF Hot Blast stoves through digitalisation initiative to reduce BF gas consumption.
- Energy savings by installation of Motor with drive in Hydraulic system in EOF2 .
- Installation of variable-voltage/variable-frequency (VVVF) drive in BLM Furnace blowers, Descalar and Internal circulating water pump house motors resulted in energy saving.
- Energy savings at Sinter Plant-2 through Waste gas ID fan impeller replacement with increased bed height operations.
- Solid fuel saving at Sinter Plant-2 through installation of three row burner with increased bed height operations.
- Installation of VFD in BF-2 cooling tower fans (8 No’s).
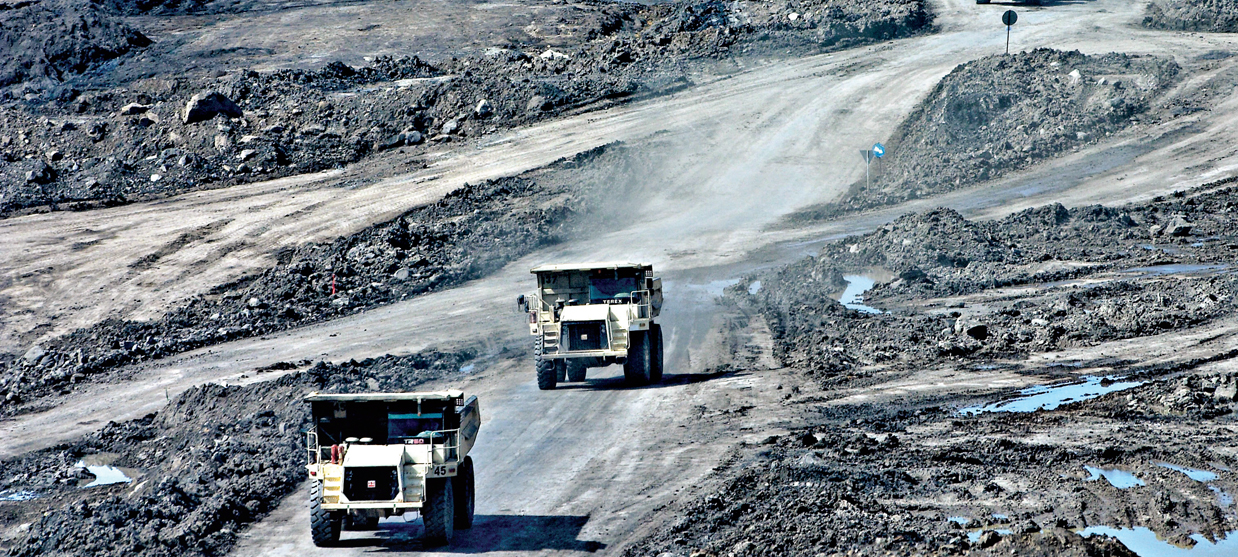
Iron ore and coking coal are the two key raw materials in steel production, accounting for nearly 64% of the total cost of steel production. JSW Steel has launched several strategic initiatives to secure the availability and procurement of these two raw materials.
7.1 Iron Ore
JSW Steel has undertaken a significantly large capacity expansion project. As capacities grow, the need for iron ore proportionately increases. To ensure continued iron ore supply with a cost advantage, the Company has initiated an aggressive backward integration strategy to gain more control over its value chain and get direct access to iron ore. The Company has acquired six iron ore mines in Karnataka.
Apart from sourcing from its captive iron ore capacity of 5 MTPA, the Company also procures from third-party sources, domestic or international, depending on availability and cost. During FY 2018- 19, the Vijayanagar and Salem facilities benefited from the captive iron ore supply while Dolvi Works sourced from Chhattisgarh, Odisha and through imports.
The Company has acquired international and domestic entities and forged strategic tie-ups to bolster its integration process. It has also invested in upgraded technologies to transform low grade iron ore into higher grade usable inputs.
7.2 Coal
India’s coking coal supply is dependent on imports. JSW Steel has diversified its sources well to ensure uninterrupted coke supply. The Company has taken a conscious decision to reduce its dependency on Australia, which was mired in mine, rail and port issues.
The Company restarted coking coal mining operations in the US in FY 2018-19, after a gap of almost three years, as the rise in coking coal prices has made it viable. Though the Company does not plan to import the coking coal produced in the US to India, this coal production will provide a financial hedge as it will be sold in the open market. To reduce import dependency and ensure partial security of raw material, JSW Steel engaged in domestic steel supply initiatives by participating in coal linkage auctions for the non-regulated sectors. It acquired one coal mine in Jharkhand in FY 2018-19.
To ensure that its dependence on premium coking coal is optimised with a customised blend of carbon bearing materials of improved quality, the Company continues to leverage its in-house state-of-the-art blend management system. To increase cost benefits by optimising coal usage, PCI injection has also been undertaken in the units. Such measures have reduced production costs and coking coal consumption substantially, while improving resource efficiency, maintaining smooth operations, and keeping costs under check.
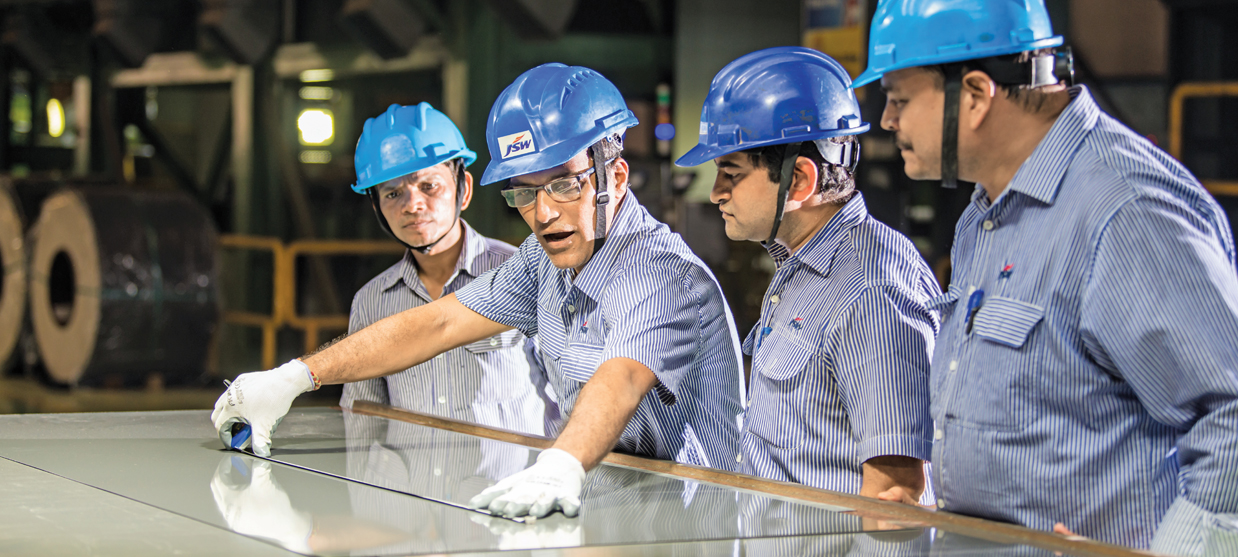
JSW Steel invests in its talent pool as much as it does in business processes to generate value over time. It involves multiple facets, from tracking career paths, creating opportunities and mentoring, to creating an ambient workspace. In FY 2018-19, JSW Steel formulated a ‘people first’ approach in diverse domains using technical knowhow, data analysis from surveys and a solid understanding of organisational behaviour.
8.1 Learning & Development – People and Skills
Given the dynamic business environment, it is important to focus on continuous learning and development of the workforce. JSW Steel has created a framework to hone the skills and capabilities of its people to succeed in their line of service. The Company conducted three critical surveys in FY 2018-19 to advance the career paths of existing workforce.
These were related to:
- Performance Management System
- Future Fit Assessment
- Great Place to Work
The data collected from these surveys was decisive in creating a grade-wise systematic learning intervention aimed at instilling leadership skills, enhancing functional skills and building next role capabilities.
8.2 Future Fit Leaders
Shifting workplace expectations have led to a parallel need for effective leaders. These leaders not only serve critical business needs but also adapt to emerging changes better. With this in mind, JSW Steel launched the ‘Future Fit Leaders’ programme, to identify potential Future Fit Leaders or FFLs, nurture their talent and make a positive impact on their career progress. In FY 2018-19, 68 Future Fit Leaders were trained across different business units within the JSW Group. The programme involves a comprehensive leadership capability development journey that includes a structured framework to impart training and development. In partnership with leading business schools, FFLs’ development journey is further sustained by Action Learning Projects and Individual Development Plans (IDPs) specific to their next identified role.
Highlights of Future Fit Leaders Programme in FY 2018-19
1,104
Total number of employees in Initial Assessment Process
22
Total number of Band-3 FFLs who started their leadership development with Cornell University
196
Total number of employees shortlisted for 1 day in-person development centres
515
Total number of shortlisted Band- 4 and Band-5 employees for programme
68
Total number of Future Fit Leaders
46
Total number of Band-4 and Band-5 FFLs who begun their development with the Indian School of Business
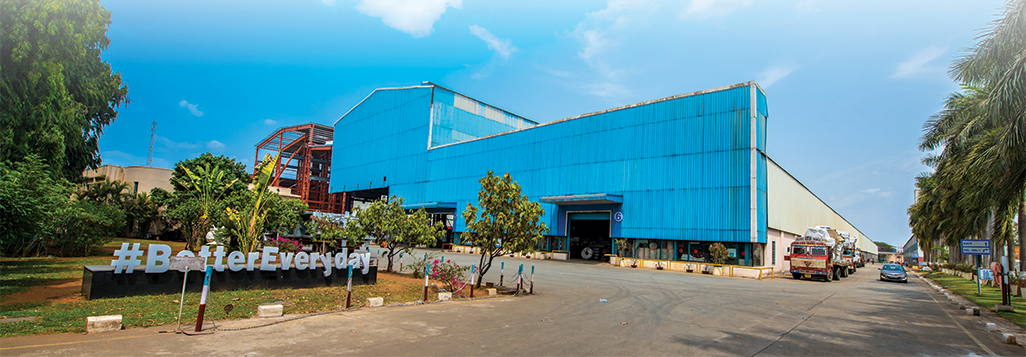
8.3 IIM Ahmedabad Strategic Leadership Programme
As the name suggests, JSW IIM Ahmedabad Executive Education programme is intended to develop analytic, strategic and leadership skills. The programme’s objective is to upskill employees and make them quick thinkers, better decision makers and efficient managers. In FY 2018-19, as a part of the second batch of the programme, 28 participants embarked on this journey of personal and professional progress.
8.4 JSW diversity and inclusion – Springboard
As one of the leading steel companies in India, JSW Steel has been working towards creating an empowering and rewarding working environment for women. The Company puts gender equality on top of its agenda and makes diversity one of its key business and people strategy components.
The Diversity and Inclusion Policy for JSW Steel was unveiled in FY 2018-19. This policy aims to ensure that all those participating in its workplace are treated with respect, dignity and fairness, thus creating an environment which promotes positive working relationships.
8.4.1 IIM BANGALORE WOMEN LEADERSHIP JOURNEY – BATCH OF 2018
With a focus on creating next generation women leaders, JSW Steel launched the IIM Bangalore Women Leadership programme. A batch of 67 high performing women employees were selected to propel their careers around the organisation’s business needs. They were trained in self awareness, career management, personal branding and in strategic subjects such as macroeconomics, industry analysis and design thinking. These women will be JSW Steel’s drivers of change.
8.4.2 GENDER SENSITISATION WORKSHOPS
In order to reduce workplace deviance behaviours and generate respect for individuals irrespective of gender, JSW Steel conducted gender sensitisation workshops for the leadership team and all the line managers. These workshops helped close gender gaps and further workplace equality.
The workshop helped achieve the following:
- Addressed concepts of diversity and inclusion
- Imparted concepts of bias and its origin
- Conveyed impact of cultural programming and stereotypes
- Contrasted impact of implicit bias and explicit bias
- Elaborated on unconscious bias
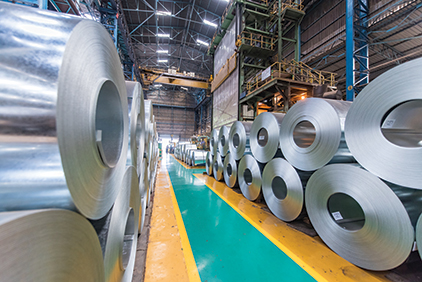
8.5 Pre-Retirement Workshops
To help employees and their spouses understand important aspects of retirement, prepare them for challenges ahead of time and ensure that they make the most out of their post retirement time, JSW Steel conducted pre-retirement workshops. Conducted by the Senior Leadership Team at the Vijayanagar and Kalmeshwar facilities, the workshop covers four important aspects, as listed below.
- Psychological Preparedness
- Social Preparedness
- Financial Preparedness
- Health Preparedness
8.6 Sammaan- Safe spaces make great workplaces
In FY 2018-19, the Company revised the Prevention of Sexual Harassment (POSH) policy under an initiative called ‘Samman’. This was done with the objective of emphasising safe and harmonious work culture within the Company. The revised policy was an effort to create awareness on the subject, often considered a taboo and develop ‘speak up’ culture to receive help from the organisation. Going a step further, JSW Steel specially curated e-learning modules to maximise awareness and highlight various nuances of sexual harassment. Using the forum theatre technique, the facilitators enacted scenarios and provided techniques to handle such situations effectively and raise concerns, as and when necessary.
8.7 JSW Campus Connect initiatives
JSW Group has been playing a key role in shaping the careers of young professionals across India. Its various internship programmes with their structured approach, strong mentorship and meticulous evaluation process act as a career launchpad for aspiring talents.
| Internship Programmes | Duration | Programme Details |
|---|---|---|
| Summer Internship Programme (SIP) | 8 weeks | Graduates from India’s premier institutes such as IITs / BITS Pilani / LSR / SRCC / St. Stephens / GLC / Symbiosis are trained at a grassroot level and the best performers are presented with Pre-Placement Offers (PPOs). |
| Graduate Rotation Programme (GRP) | 2 years | Post the acceptance of their SIP PPOs, students join the organisation and are given an opportunity for immense learning and exposure in the core businesses. On programme completion, GRPs are assessed basis which they are sponsored by JSW Steel for higher education in Ivy League colleges |
| Management Internship Programme (MIP) | 8 weeks | Management degree holders from Premier B-Schools such as IIMs / JBIMS / TISS / XLRI are exposed to business process and systems. Their performance during the programme period is evaluated and the best candidates are presented with PPOs. |
| Management Trainee (MT) | Not Applicable | Post accepting the MIP PPOs, the MTs join the organisation as laterals across the Company’s businesses. They are groomed in business acumen and are made future ready to assume leadership roles. |
8.8 E-learning initiatives in FY 2018-19
To adapt to the dynamic business environment, JSW Steel has curated a wide spectrum of courses ranging from behavioural, interpersonal and functional skills. These are hosted on the ‘Learning Academy’ platform. Employees can always avail the system and propel their learning curve. The response of this initiative can be judged by its rise in utilisation metrics and registrations, which rose from 69% to 85% during FY 2018-19. The Company held a spot at the Skillsoft Global Innovation Awards for creating an impact in the manufacturing sector.
#GirlswannaLearn: Skillsoft online learning courses spread over a month for women employees to enhance business performance
Desktop courses: Additional courses to supplement employees learning on MS Excel and MS PowerPoint skills
HMM Spark: Harvard Managementor Spark (HMM Spark) is a mobile application intended to provide personalised, best-in-class leadership and management content to employees on-the-go
Skills 2020: An initiative where Skillsoft courses were categorised based on the most important skills employees should possess by 2020 according to the World Economic Forum
8.8.1 WAY FORWARD FOR FY 2019-20
Steel University courses: In partnership with the World Steel Association, JSW Steel will make Steel University courses available on the ‘Learning Academy’ online platform. The courses will be powered by exciting simulations and 3D models, gamification and interactive learning helping employees learn courses on steel manufacturing, applications and basics of metallurgy. The Company has plans to partner with DuPont to develop e-learns on safety measures.
Kwench library services: Another service catapulting learning among employees. The utilisation for this service went up to 70% in FY 2018-19.
8.9 Employee Engagement at JSW Steel
JSW Steel gives due priority to employee satisfaction metrics. It had conducted an employee engagement survey administered by the Great Places To Work (GPTW) Institute in 2016. The insights derived from the survey gave birth to a host of activities. Some of the key actionable areas included:
- Emotionally and mentally safe place to work.
- Improve perception on respect and fairness by building people manager capability.
- Build culture of appreciation through non-monetary recognition.
Candid Conversations
A platform encouraging employee-leadership interaction. In an informal set up, a group of high performing individuals are nominated every month to meet and learn from leaders at JSW Steel.
JSW Voice Pulse Survey
Launched at JSW Steel to empower employees speak up on key business areas. Such response coming right from the employees at ground level helped churn out essential initiatives for FY 2019-20.
‘Samvedna’
A series of mental and emotional wellbeing and awareness workshops to help employees understand the importance of mental health and develop fundamental coping mechanisms
JSW We Care
First ever Employee Assistance Programme (EAP) was launched in December 2018 in partnership with 1to1help, a leading Employee Assistance Programme service provider. The initiative is aimed at providing psychological and emotional counselling support to the employees along with online self-help tools, e-workshops and assessments.
‘How’s the Josh’ Awareness sessions and contests
Awareness sessions and contests for local HR SPOCS conducted to spread awareness among the employees at various locations. This has helped to engage the stakeholders and employees and in turn led to a boost in adoption of the EAP among the employees.
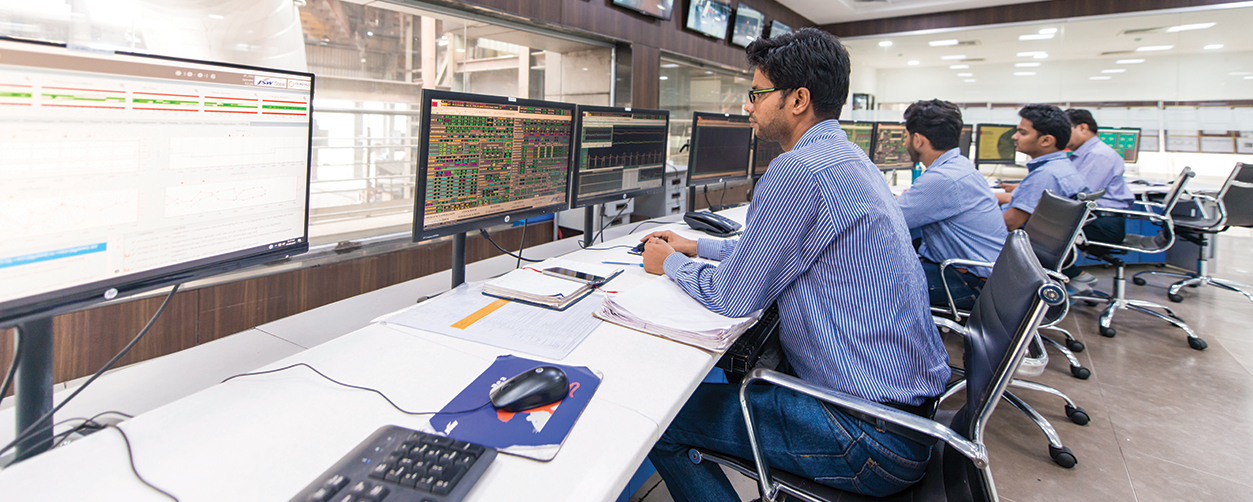
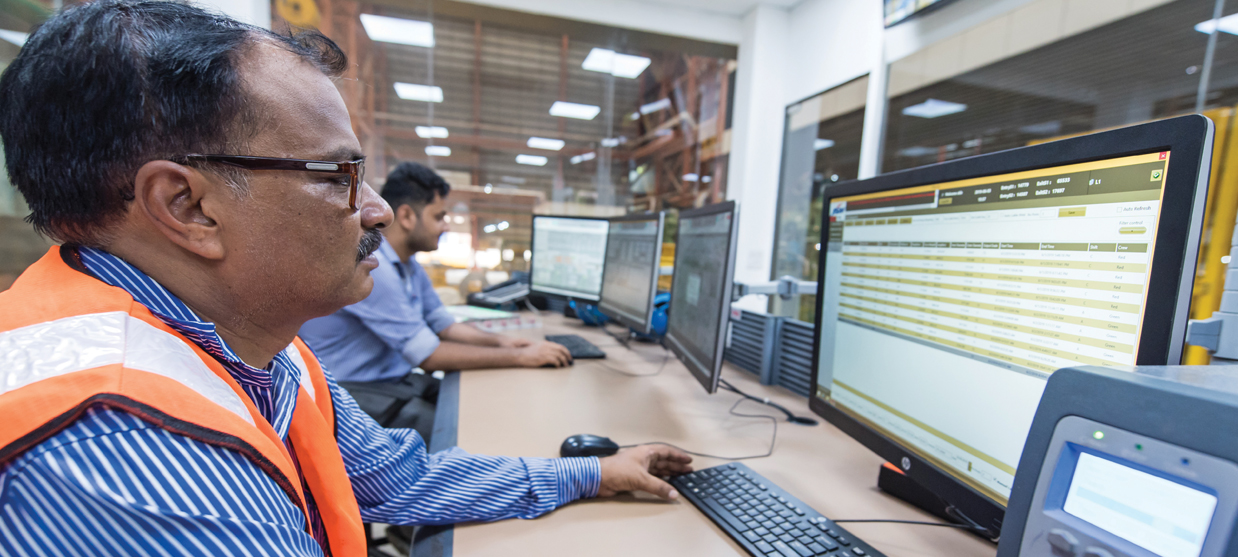
JSW Steel has always taken conscious efforts to be a step ahead of its peers in adopting digital technologies to achieve efficiencies and thus create value for the business. Towards this end, the digital transformation journey, named ‘Athena’ commenced in 2017.
The Company uses various technologies, including Industry 4.0 interventions such as machine learning, Internet of Things (IoT) and Artificial Intelligence (AI); big data and advanced analytics; powered simulations and optimisation engines; and computer vision. These tools have helped enhance productivity, minimise human intervention and ensure greater safety. The scope of digital tools implemented at Dolvi Works facility is a case in point. The expansion projects at this facility enhance tracking and predictability of the project schedule to drive on-time completion within the budgeted cost.
The Company has also created ‘connected factories’ in procurement and large capital projects to track and manage various processes. Using digital applications, the processes results in better transparency and lower dependency on manual intervention.
Direct impacts of going digital :
Computer vision-aided video analytics is used to drive manual process time reduction, enhance throughput and improve productivity of Steel Melting Shops (SMS).
Big data and analytics driven real time models used to reduce power consumption and associated losses.
In the past two years, the Company has launched over 100 projects in digital across manufacturing, supply chain, sales and procurement. Its accruals for FY 2018-19 from digital projects was approximately `180 crore. It has also helped improve governance, boost sales, enhance customer delight and reduce discrepancies in forecasting.
Using analytics, robotics and hybrid cloud, JSW Steel is aligning business processes to dynamic sectoral and economic realities. The Company leverages the SAP platform enabling smooth data collation, decision making, and data security. The year in review witnessed several such levers to innovate, enhance and strengthen business operations, using information technology (IT) and digital platforms.
The Company has envisaged generating additional cost saving of more than `300 crore in FY 2019-20 from digital-led projects in potential areas of operations. It aims to pursue further digital technology initiatives to create differentiation and innovation, providing an edge to the organisation’s efficiency.
| Digital initiatives | Project details |
|---|---|
| Contract workforce management | FY 2018-19 saw successful completion of the workforce management pilot project at its Vijayanagar plant. The system will be deployed in all other plants in FY 2019-20. |
| Cloud adoption | JSW Steel is using hybrid cloud to modernise its data centre operations. The existing server will be migrated to SAP HANA platform in FY 2019-20. |
| Large scale capital project management tools | Deploying the tool across all its facilities to help in predictive risk analysis methods in budgeting and scheduling. |
| Procure to pay processes | The process adopted the digital route in FY 2018-19. Using best-in-breed tools, this move resulted in high partner satisfaction due to value delivery, process visibility and use of analytics. |
| Robotics Process Automation | Bots were deployed at the global business services domain, saving significantly on full-time resources (FTEs) and enhancing overall process efficiency. |
| Cybersecurity | The Company implemented robust security framework with vulnerability assessment, penetration testing and firewalls rule assessment. Roadmap for cybersecurity is charted and strictly adhered to in order to prevent any loss or data breach. |
| Digital invoicing | Invoices are digitally signed to enhance security and efficiency. |
| Hire to retire process | The Company deployed best-in-class solutions for compensation management, career development, succession planning along with existing performance management, recruitment, learning and onboarding modules. |
JSW Steel follows the globally recognised ‘COSO’ framework of Enterprise Risk Management. ERM brings together the understanding of the potential upside and downside of all those factors which can affect the organisation with an objective to maximise sustainable value to all the activities of the organisation and to its stakeholders.
The Company recognises that the emerging and identified risks need to be managed and mitigated, in order to:
- protect its shareholders and other stakeholders’ interests.
- achieve its business objective
- enable sustainable growth.
Pursuant to the requirement of Regulation 21 of the Securities and Exchange Board of India (Listing Obligations and Disclosure Requirements) Regulations, 2015 and Clause 49 of the erstwhile Listing Agreement, the Company has constituted a subcommittee of Directors to oversee Enterprise Risk Management framework to ensure resilience such that:
- Intended risks, say growth, are taken prudently so as to plan for the best and be prepared for the worst.
- Execution of decided strategies and plan with focus on action.
- Unintended risks like performance, incident, process and transaction risks are avoided, mitigated, transferred (like in insurance) or shared (like through sub-contracting). The probability or impact thereof is reduced through tactical and executive management, policies, processes, inbuilt systems controls, MIS, internal audit reviews etc.
10.1 Key risks and response strategies
| Risk type | Movement | Impact | Response strategies |
|---|---|---|---|
| Strategic | |||
| Competitive dynamics & industry cyclicality |  |
The following can affect sales
& margin:
|
Company de-risks by -
|
| Marketing |  |
Increasing competition post the recent consolidation in steel industry driven by IBC process |
|
| Raw material availability and cost – Iron ore | |
High cost of iron ore
impacting the EBITDA. Availability and cost of required grade of Iron ore are impacted by:
|
|
| Raw material availability & cost – Coking coal | |
Risk of production stoppage
due to non- availability of
coking coal for the capacity
expansion at Dolvi and other
locations since JSW Steel is
solely dependent on import.
|
|
| Exchange rate fluctuation | |
Foreign currency - rupee depreciation against US$ from `65 to `74 during the year. Such volatility may increase the cost of the imported raw material and increase the dollar denominated borrowings. |
|
| Interest rate | |
Risk of high borrowing cost
impacting the profitability. Globally there is increasing trend of the interest rate - Fed raised the key rate in the range of 2% to 2.25%. LIBOR increased 50 bps since March 2018. During the year RBI has cut repo rate by 50bps there by signaling accommodative stance. |
|
| Mergers & Acquisitions | |
|
De-risking strategies -
|
| Operational | |||
| Infrastructure and logistics | |
Company is in process of
brownfield expansion at its
Dolvi plant. Various factors can affect movement of enhanced quantity of inbound raw material and outbound goods like -
|
Various measures are being taken such as –
|
| Availability of power for production | |
Company’s proposed expansion at Dolvi would increase the power requirement. Inadequate power supply and network bandwidth may lead to operational interruptions and affect production. |
|
| Environment | |
|
|
| Health and safety | |
Any safety lapses would result in damage to property, assets and human capital. The steel sector is subject to extensive health and safety laws, regulations and standards |
|
| Human resource | |
Human workforce with required skillset and experience is critical for maintaining current level of operations and upcoming expansions at plants. |
|
| Cyber security | |
Cyber security risk could result
in substantial reputation and
financial loss arising from:
|
The Company de-risks by:
|
Forward looking statements
Certain statements in this release concerning our future growth prospects are forward-looking statements, which involve a number of risks, and uncertainties that could cause actual results to differ materially from those in such forward-looking statements. The risks and uncertainties relating to these statements include, but are not limited to, risks and uncertainties regarding fluctuations in earnings, JSW Steel’s ability to manage growth, intense competition within Steel Industry including those factors which may affect the Company’s cost advantage, wage increases in India, its ability to attract and retain highly skilled professionals, time and cost overruns on fixedprice, fixed-time frame contracts, client concentration, restrictions on immigration, its ability to manage internal operations, reduced demand for steel, ability to successfully complete and integrate potential acquisitions, liability for damages on our service contracts, the success of the companies in which – has made strategic investments, withdrawal of fiscal governmental incentives, political instability, legal restrictions on raising capital or acquiring companies outside India, unauthorised use of the Company’s intellectual property and general economic conditions affecting our industry. The Company does not undertake to update any forward-looking statements that may be made from time to time by or on behalf of the Company.